|
Capabilities |
A data cube is a three-dimensional matrix with two spatial axes
(right ascencion and declination) and a wavelength axis. Data in such cubes is
usually regularly gridded and only such kind of data is fully supported.
This tool was created to deal with data delivered by imaging field
spectrographs like OSIRIS@Keck, SINFONI@VLT, GMOS@GEMINI or FIFI-LS@SOFIA.
- Works with fits files and data cubes
- Automatic and manual identification of crazy pixels in data cubes
- Interpolation of crazy pixels in 1, 2, or pseudo-3 dimensions
- Operations on data cubes, like e.g. smoothing each slice of a data
cube with a gaussian PSF of median filtering each slice
- Interactive and automatic fitting to emission/absorption lines with
various profiles, thus extracting of e.g. flux maps, velocity
fields, ... Additional extraction methods are also availale. Taking
measurement errors into account.
- Extraction of spectra from data cubes
- Slit extraction and creation of pv diagrams
- Data cube viewing in 2D and 3D
- Creation of animated gifs for 2D (channel maps) and 3D data
- Contouring
- Viewing and manipulating fits header
- Preparing astrometric information
- Ability to save individual spectra, plots (in TIFF, GIF and PS format), manipulated or continuum
subtracted cubes, ...
- Ability to handle outside pixel. These are data cube elements that
are not recieving light (useful in case of mosaiced data cubes).
- Large catalogues of emission and absorption lines (Atomic, Fine
Structure, Molecules) from the optical to the far-infrared.
- Voronoi Binning method of Cappellari & Copin (2003, MNRAS, 342, 345)
- ATRAN atmospheric transmission curves of Lord, S. D., 1992, NASA
Technical Memorandum 103957. Download, Gaussian convolution to a
specified spectral resolution and plot.
- Download and view DSS images and SDSS spectra
- Regridding images to a common spatial grid for e.g. subsequent
division to create flux ratio maps
- RGB image creator
- Assigning astrometry to JPG images
- and so on and so on
FLUXER is actually a collection of IDL programs:
| FLUXER incl. helper routines like FLUXER_PLOT1D | Viewing and analyzing data cubes |
| FLUXER_ATRAN | Downloads ATRAN spectra from the ATRAN server |
| FLUXER_SDSS | Downloading images from DSS server |
| FLUXER_RGB | Creating a RGB image from three channel images |
| FLUXER_ASTROMETOR | Assigning astrometry to a JPG image saving
it as a fits RGB file |
|
Requirements |
FLUXER has been developed using IDL 8.3. It may work with IDL versions down to 7.0.
FLUXER runs under LINUX, WINDOWS and MAC.
A three-button-mouse is requested.
A minimum screen size of 1674 x 934 pixel is needed.
|
Screenshots
Click on any image to
get a larger version. |
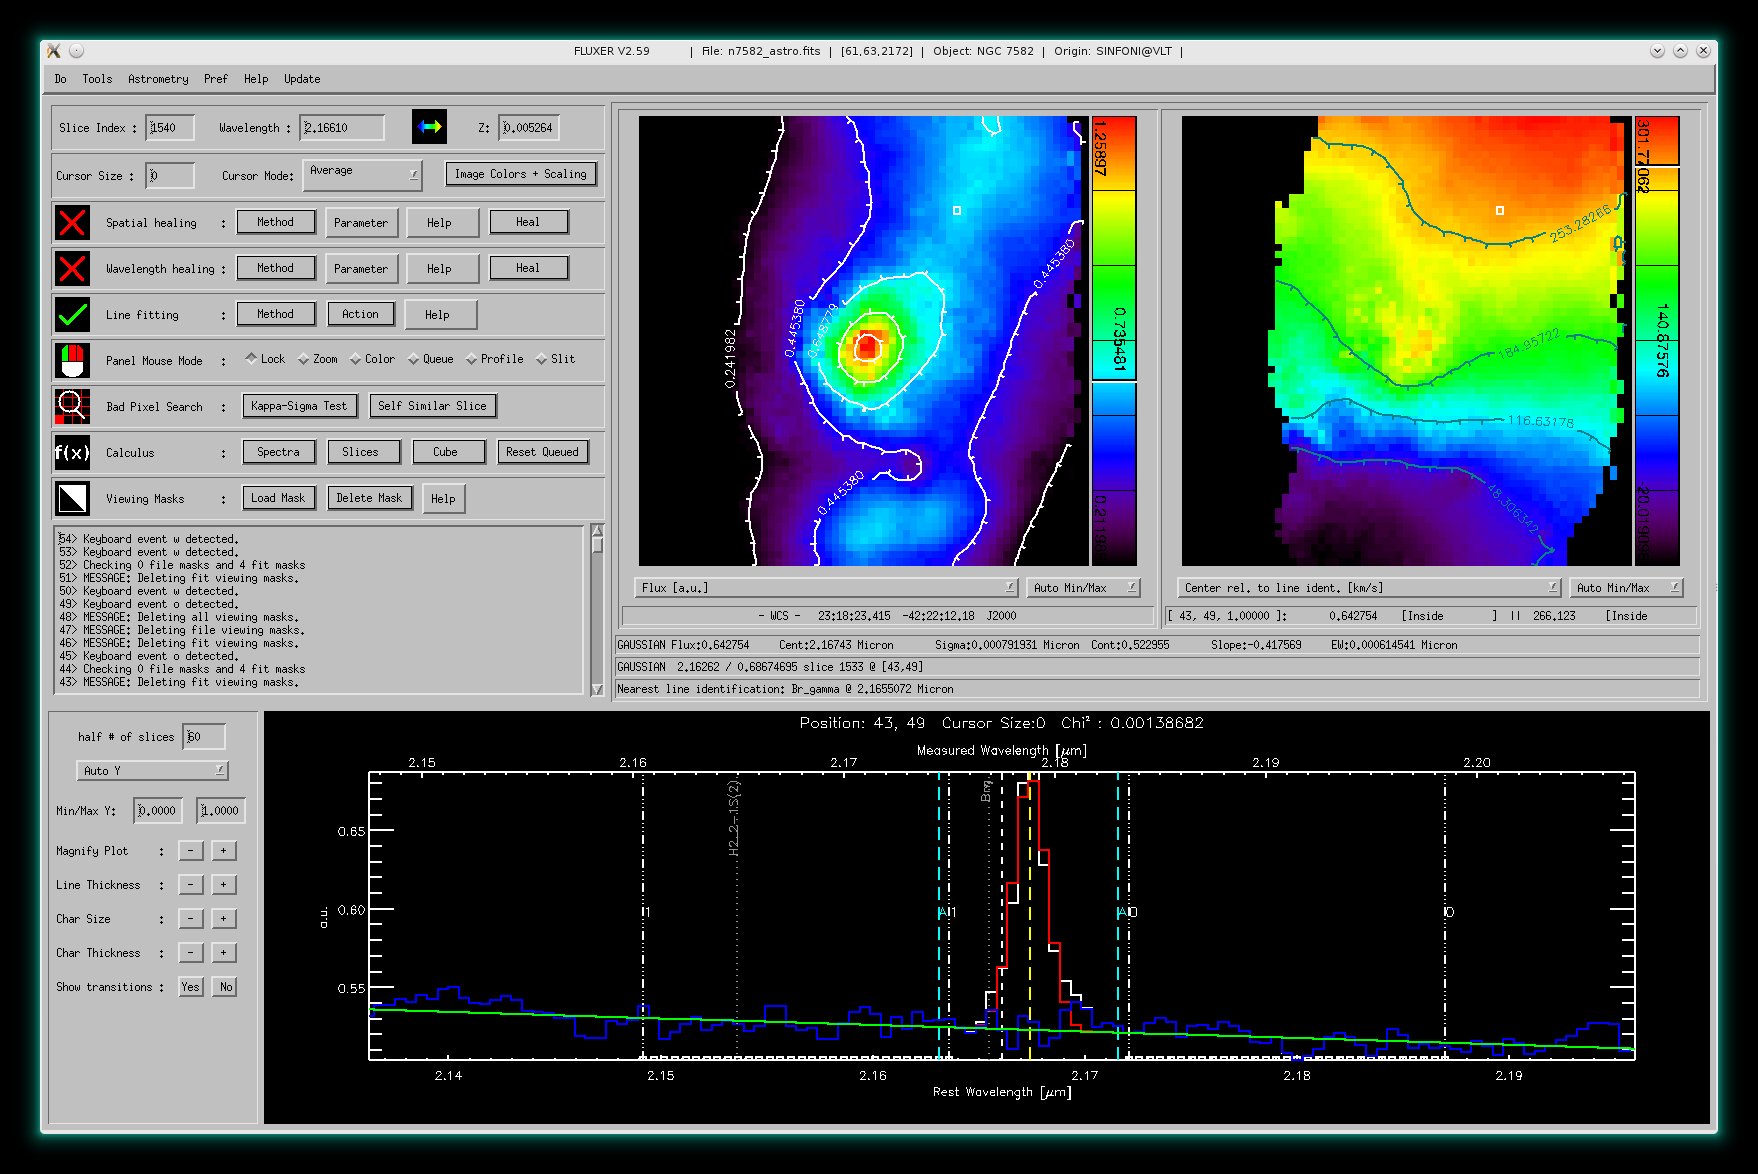
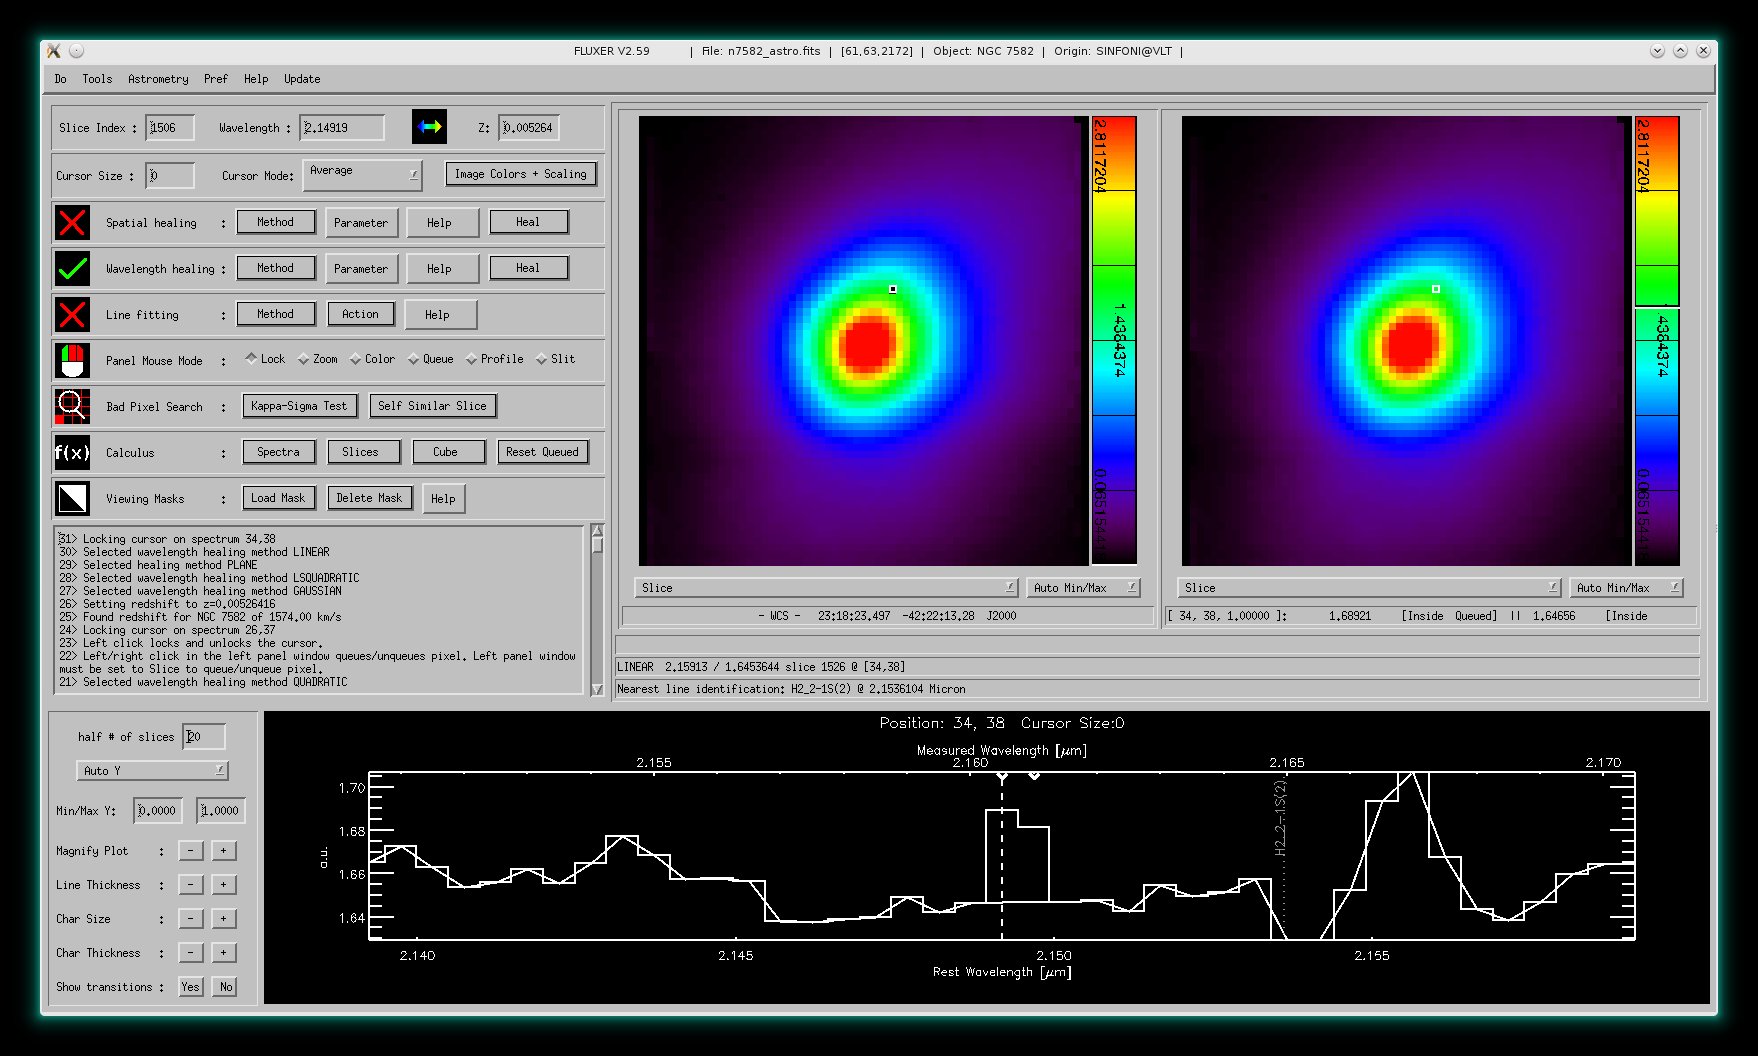
FLUXER
Line fitting mode
This mode allows to interactively fit emission and absorption lines with
various methods including peak constraints:
| Center of Intensity (COI) |
| Dynamic Center of Intensity (DCI) |
| Single lorentzian fits |
| Single or double gaussian fits |
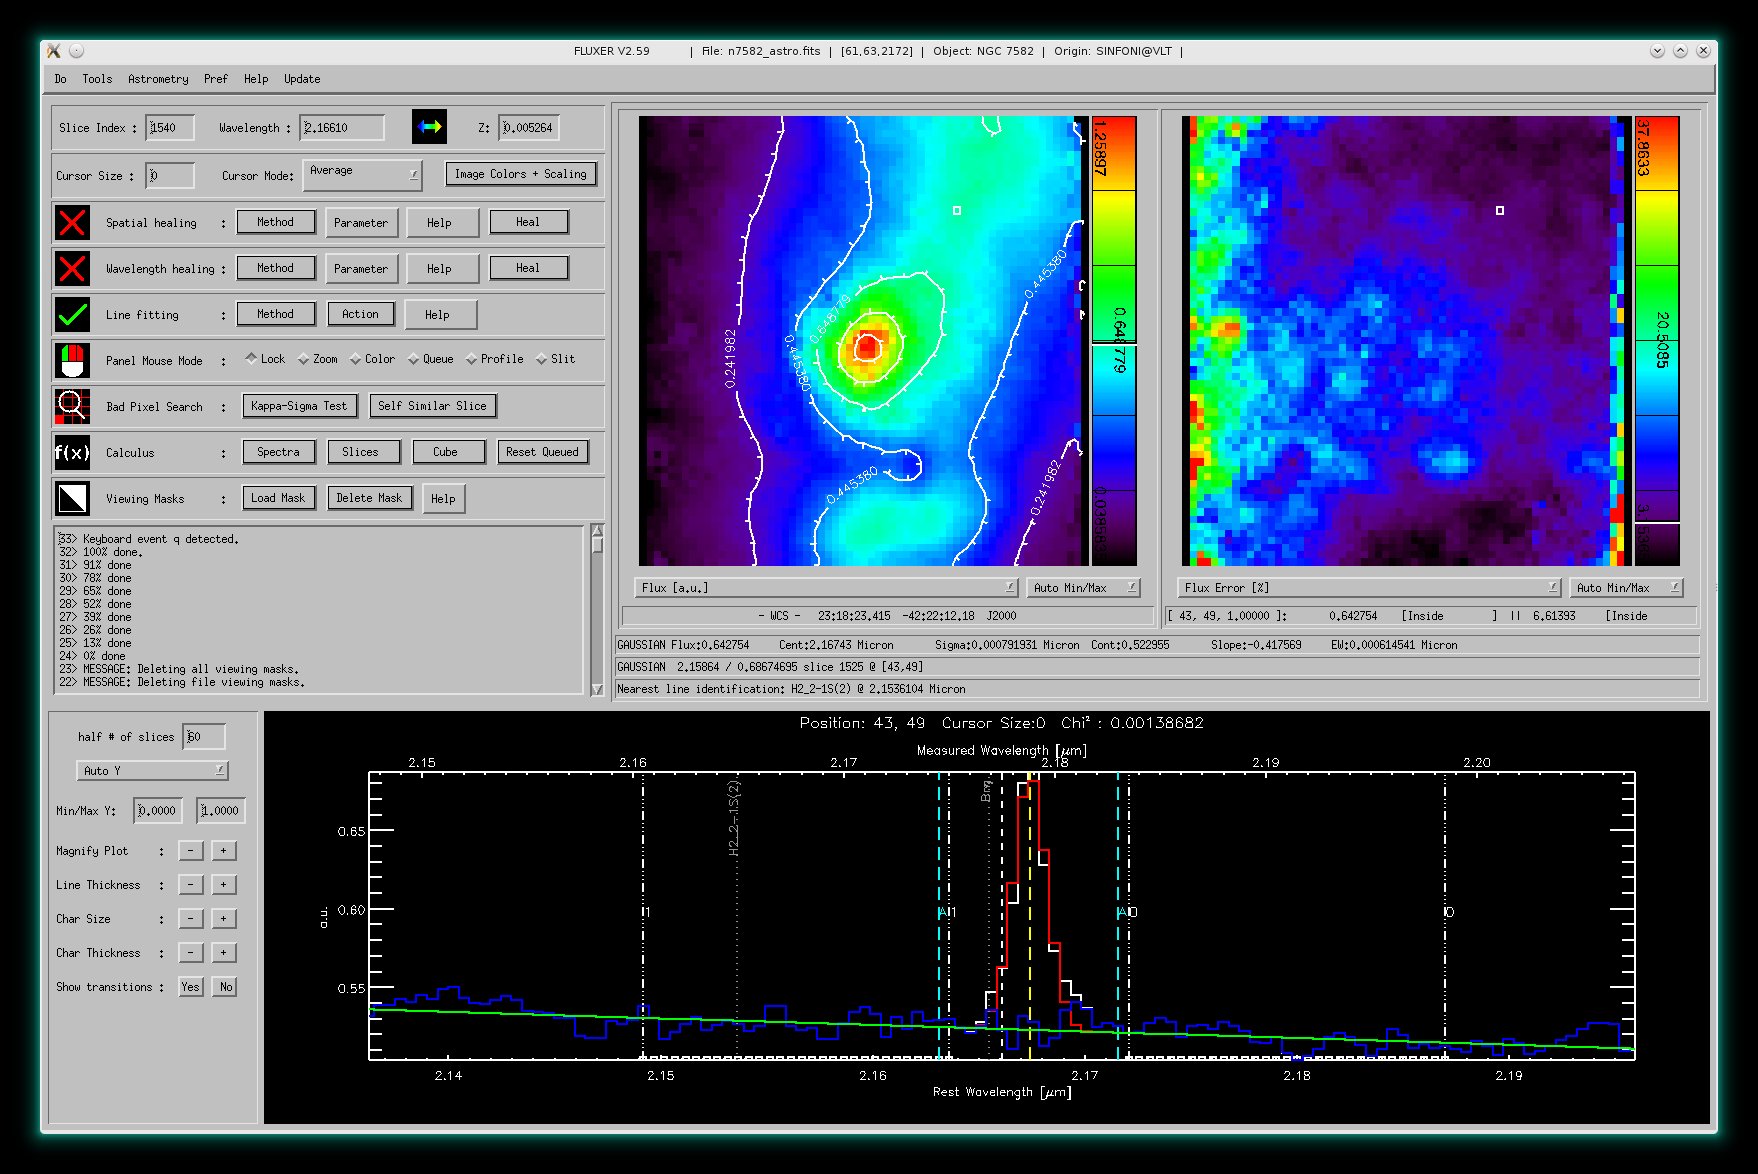
Here, a single gaussian fit to the Brackett γ emission line (2.166 micron) of NGC 7582 (data cube
obtained with SINFONI @ VLT) is shown. The left panel window shows the derived flux
values derived from Gaussian fits to all spectra with contours and the right
panel window shows the derived errors in flux.
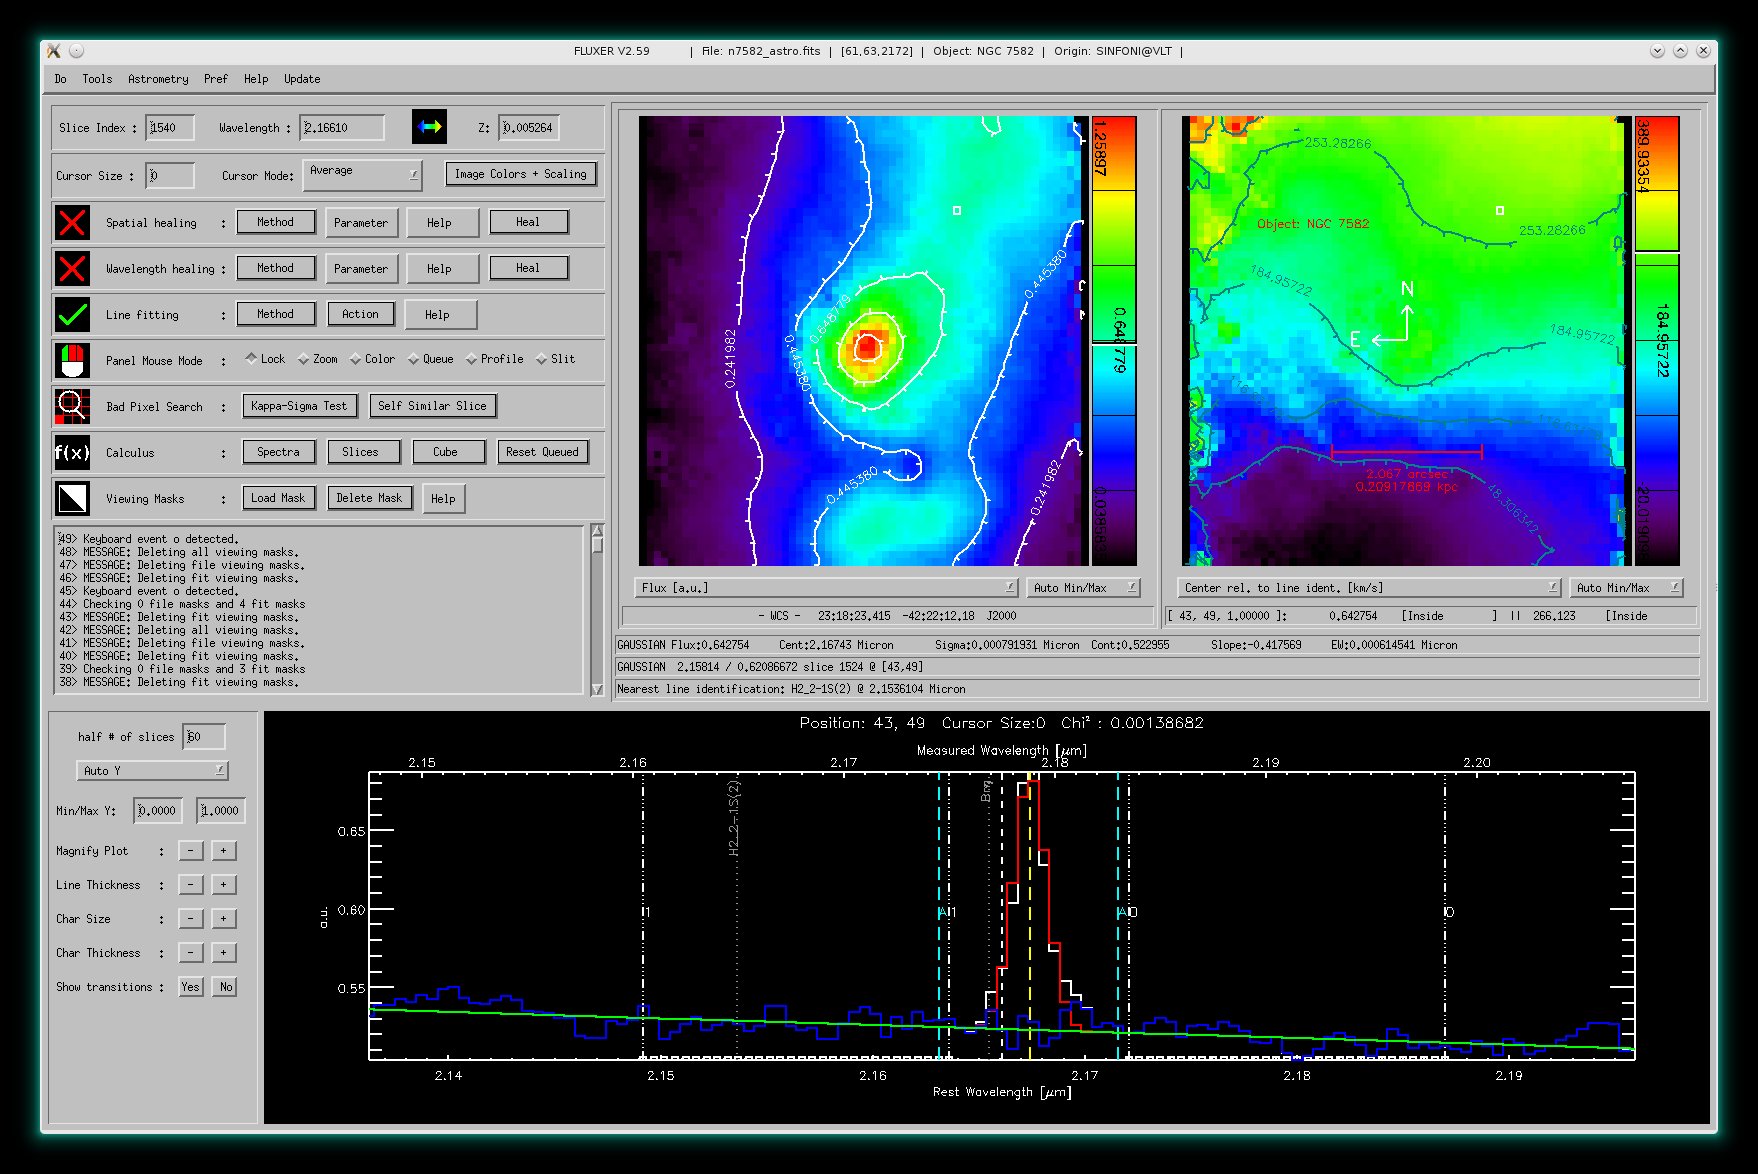
Like above but with the derived velocity field in the right panel window with red countours and with additional astrometric informations.
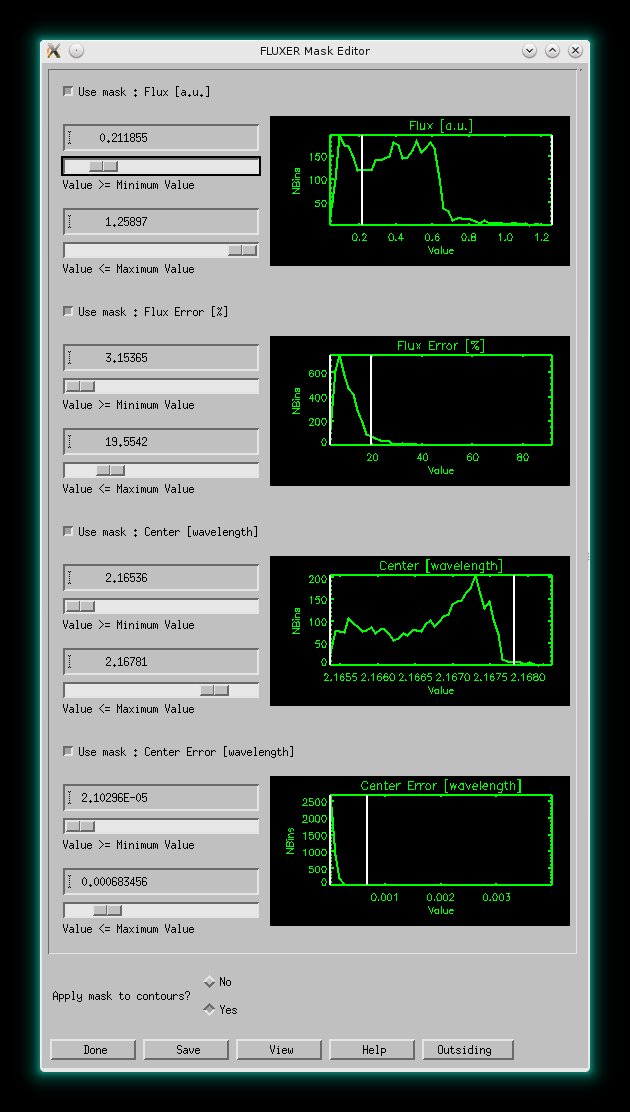
Like above but with viewing mask applied to provide better analysis and
plots. The viewing mask editor for 4 plotting constraints is also shown. It is possible to choose
up to 8 plotting constraints.
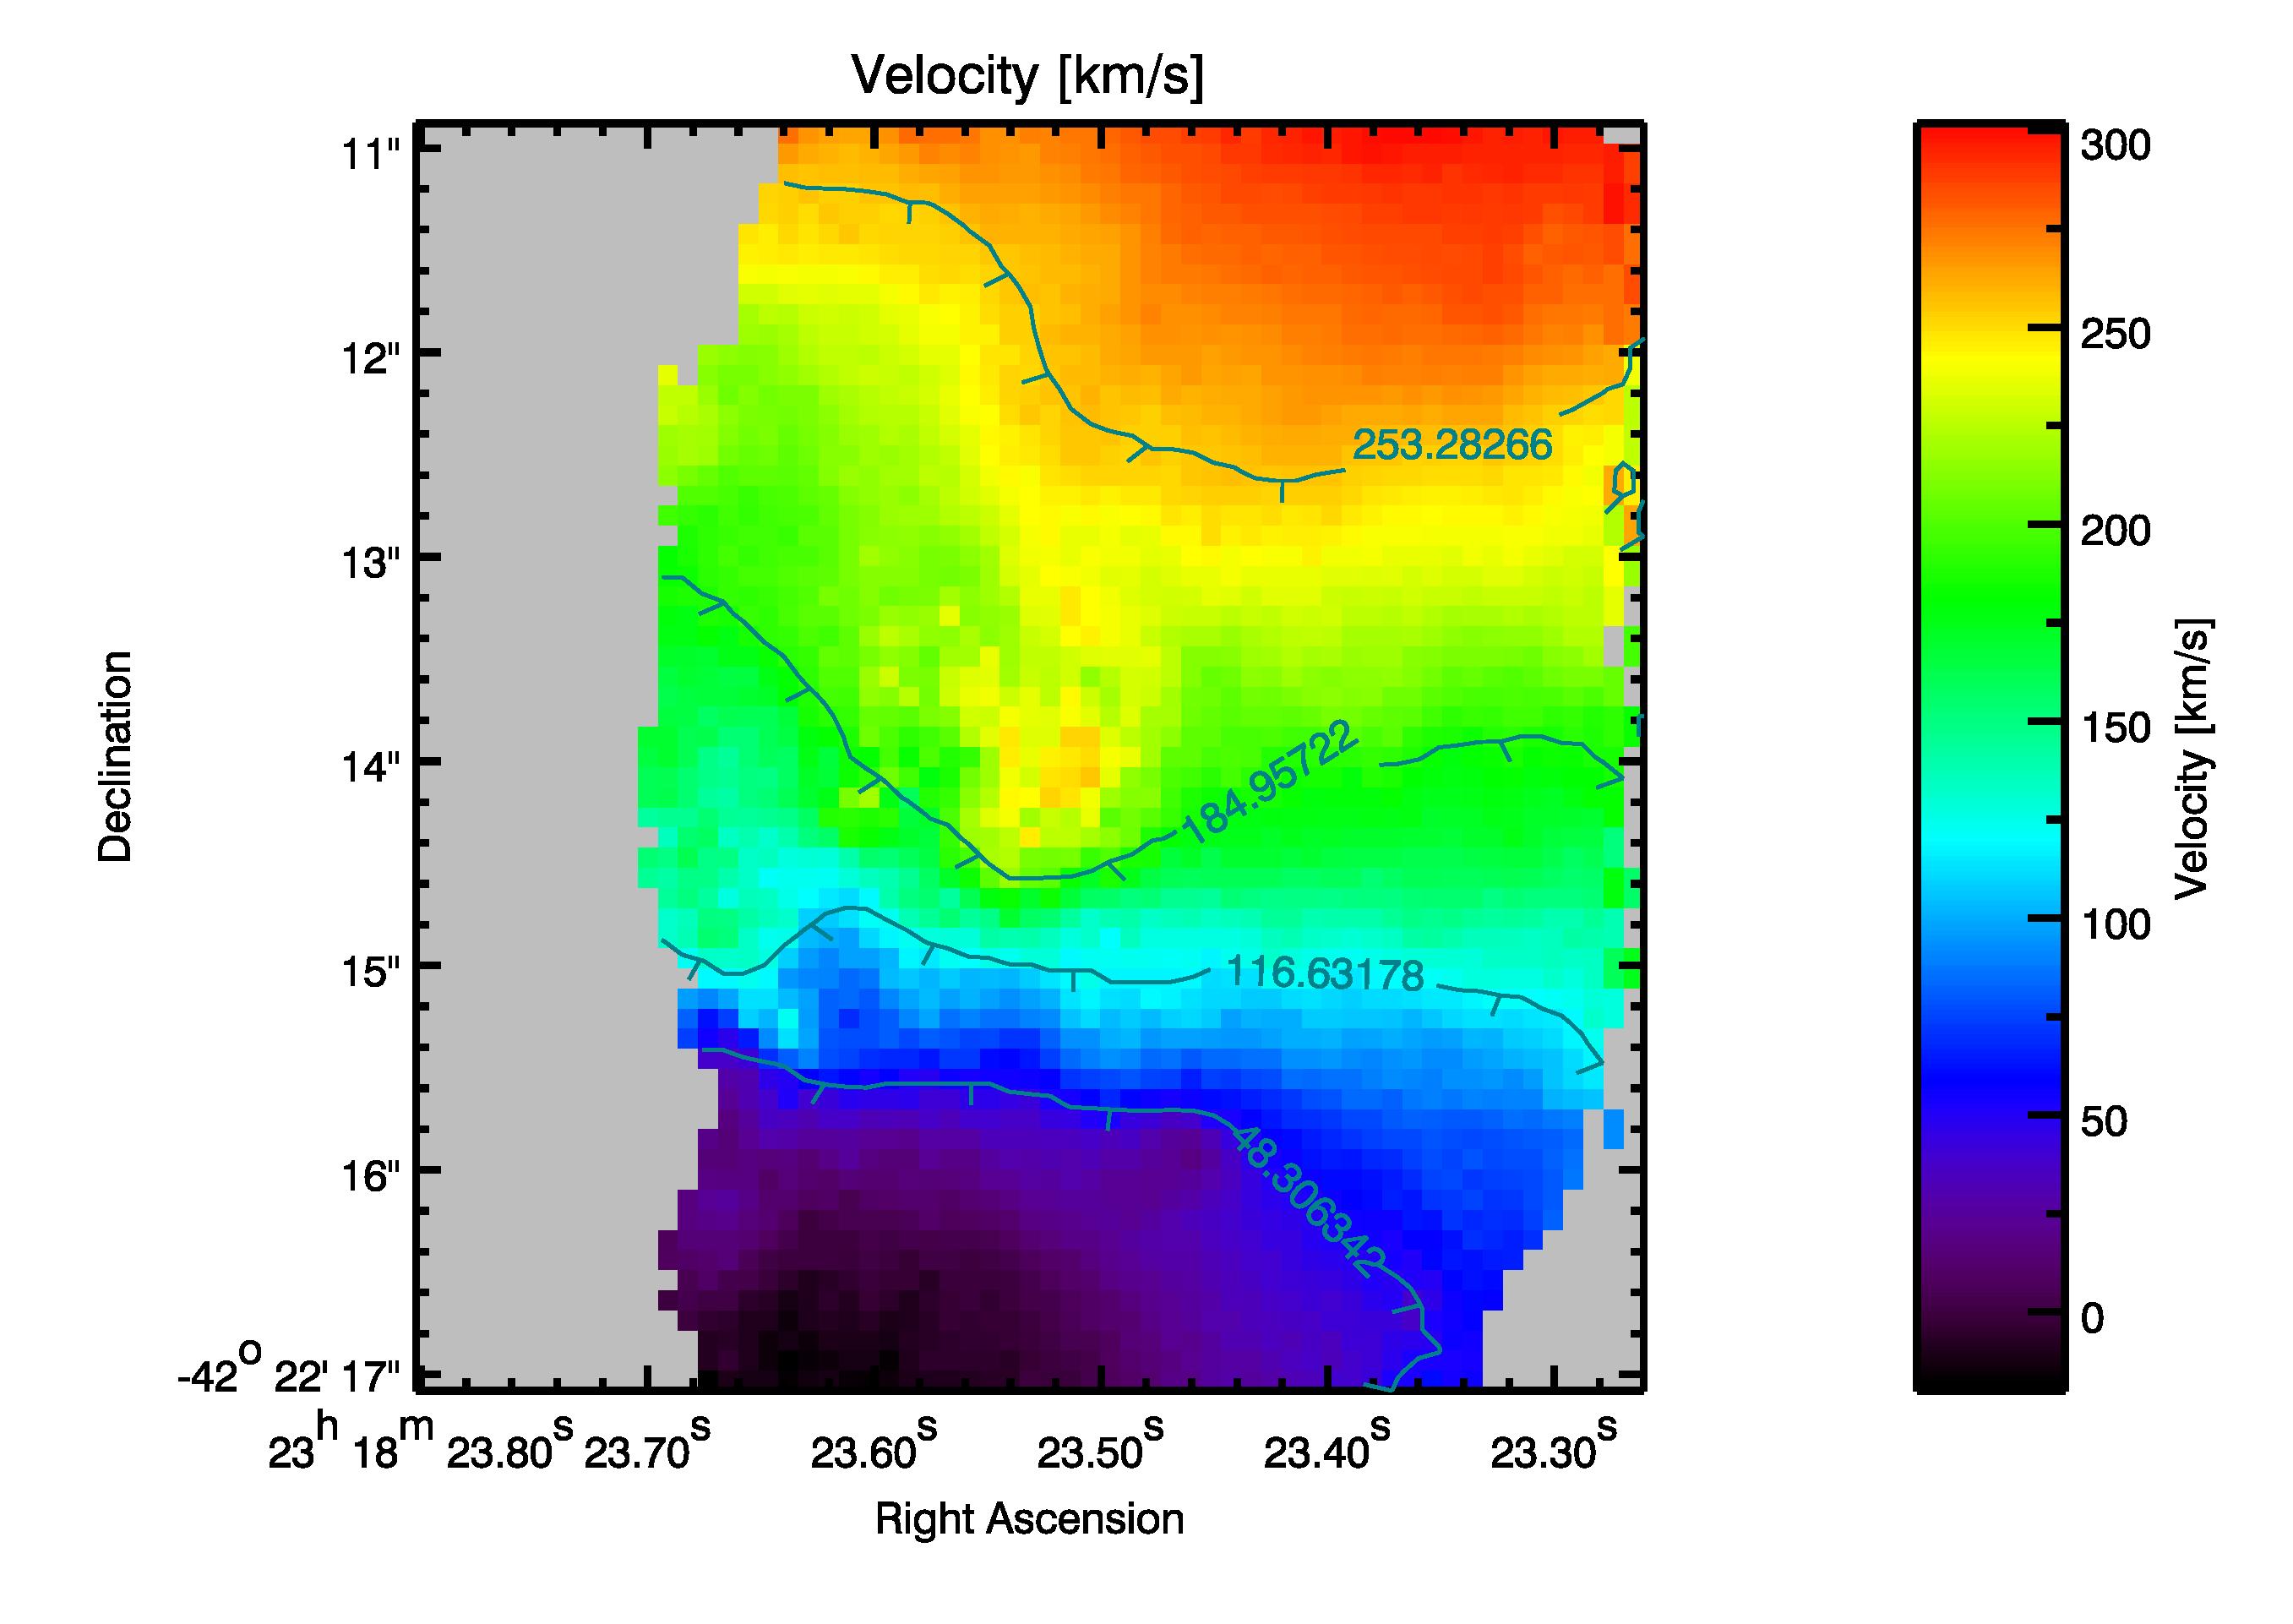
A postscript file created from the calculated velocity field. In gray the
masked data regions.
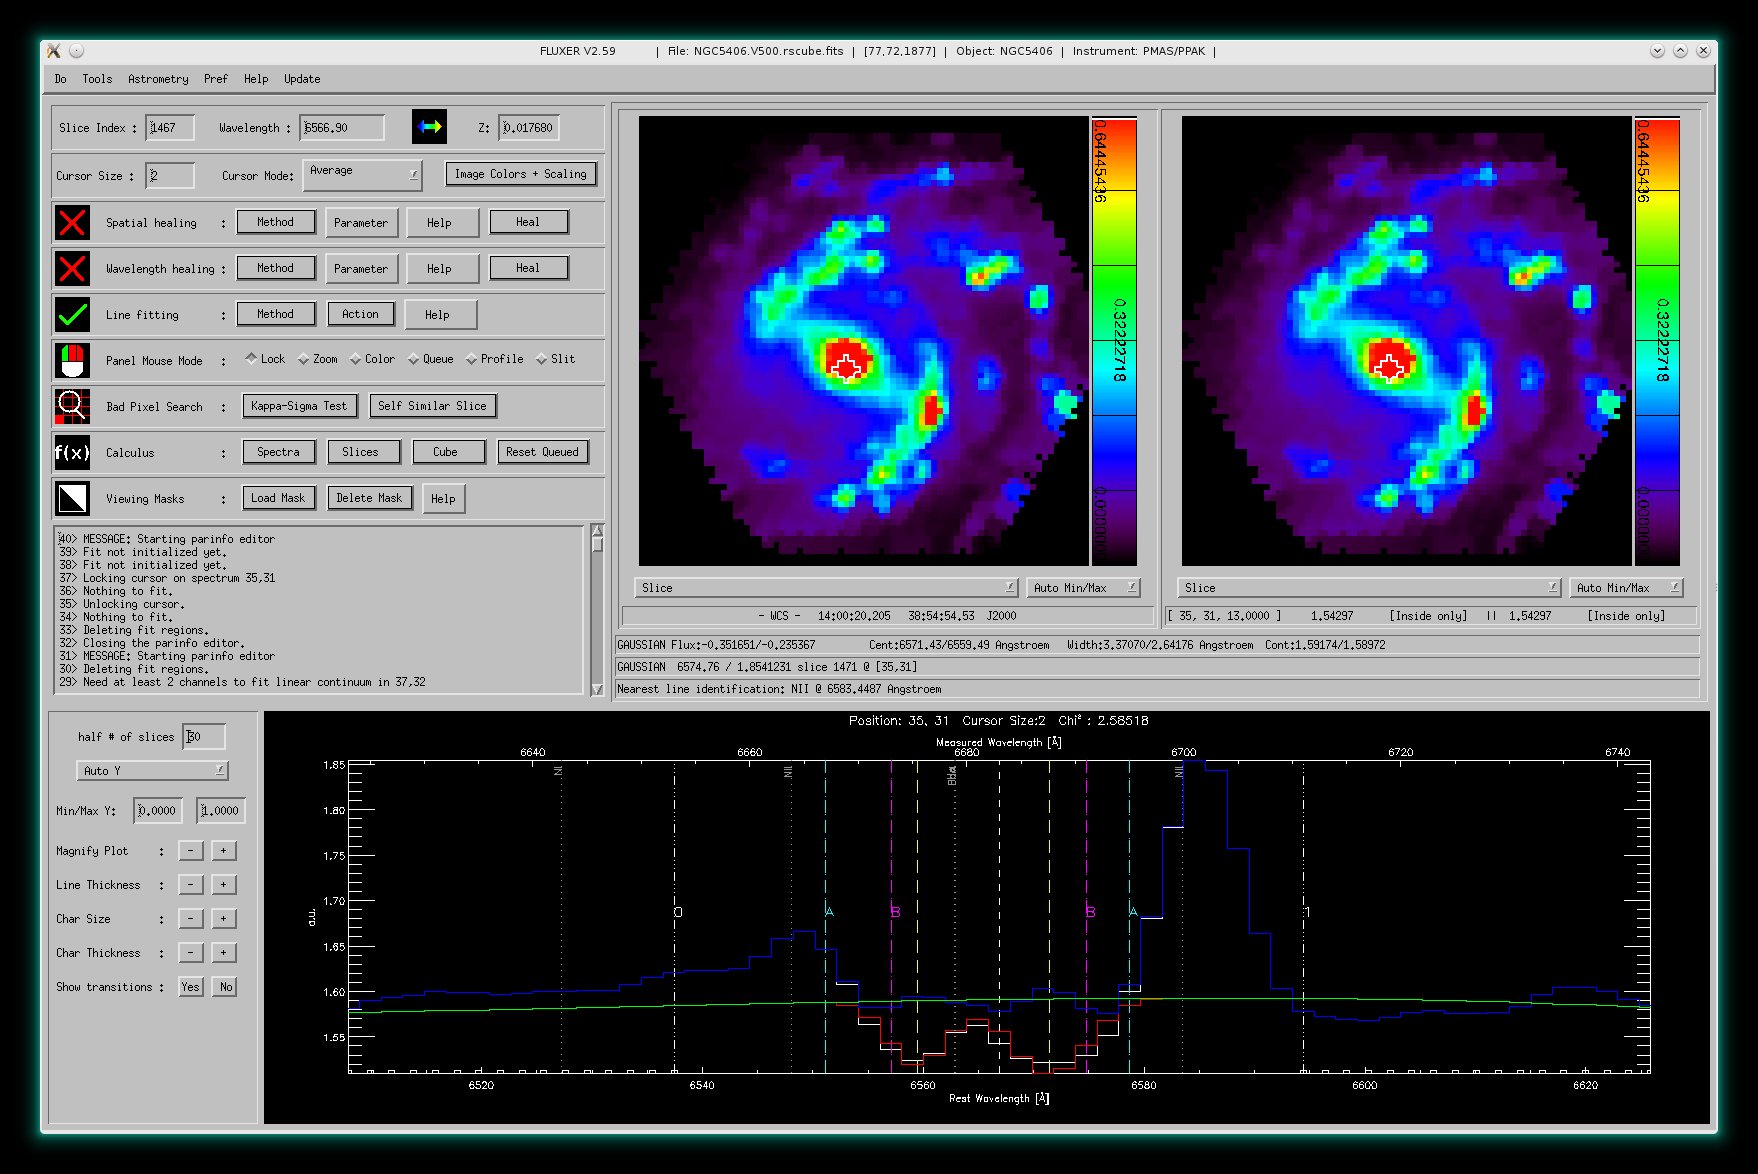
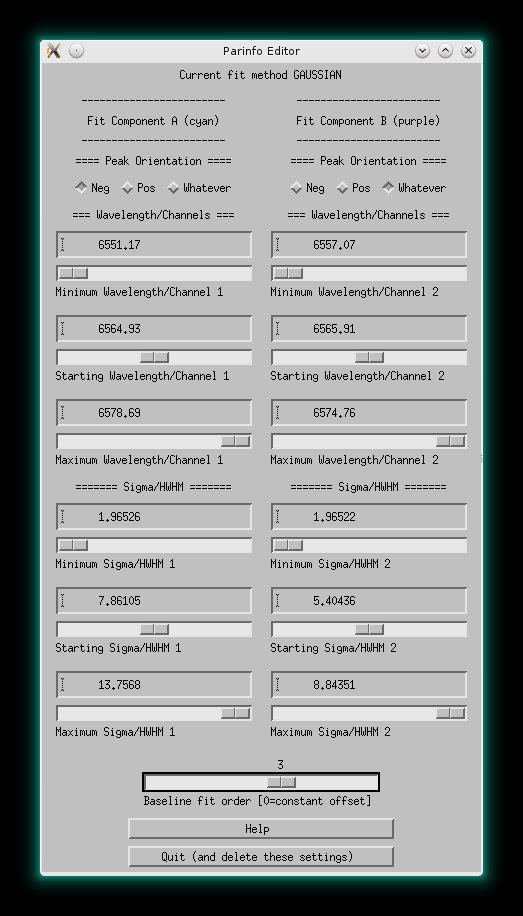
When fitting, the ParInfo Editor helps to constrain the fit parameters. In
above picture you see a double gaussian fit to the H α
emission lines (in absorption and emission) in NGC5406 (data taken with PMAS)
and the PArInfo Editor to the right.
|
Spatial healing mode
This mode allows to interactively interpolate pixel values in each slice of the
data cube.
The image shows the original slice in both panel windows.
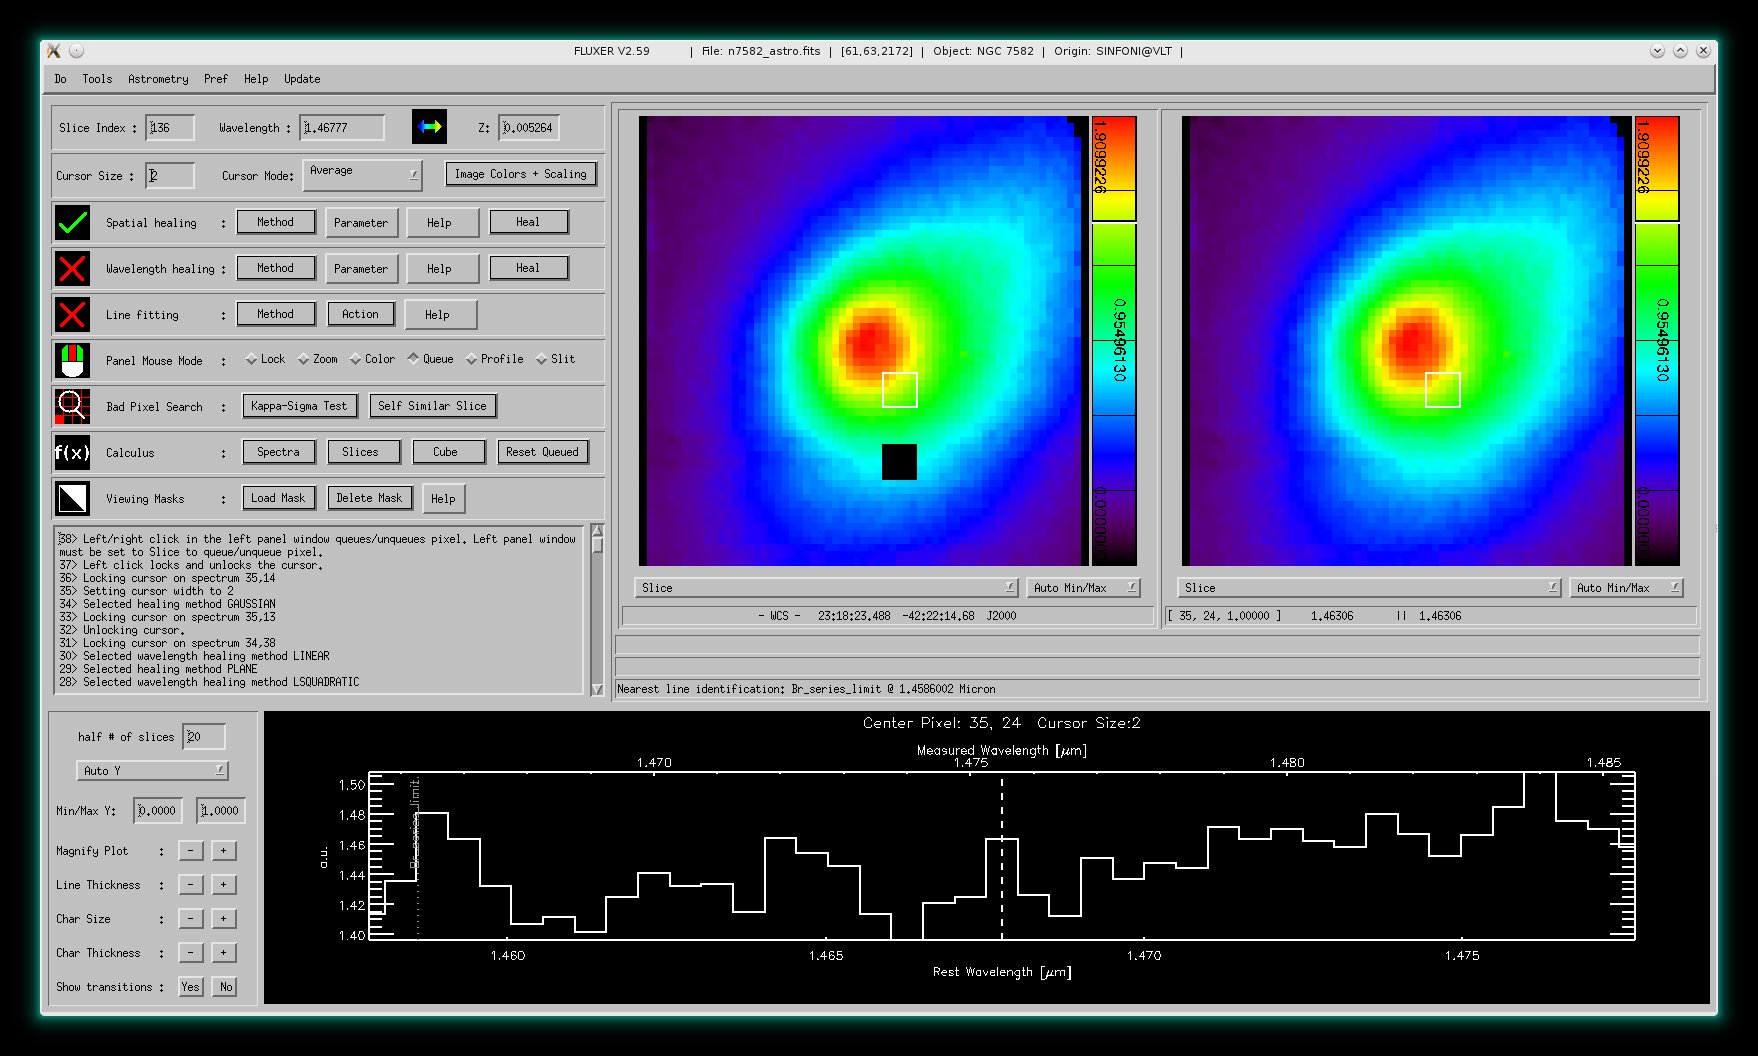
The image shows the slice with pixels marked for interpolation in black (left panel window), and
the interpolation result (right panel window). The action only took three mouse clicks.
|
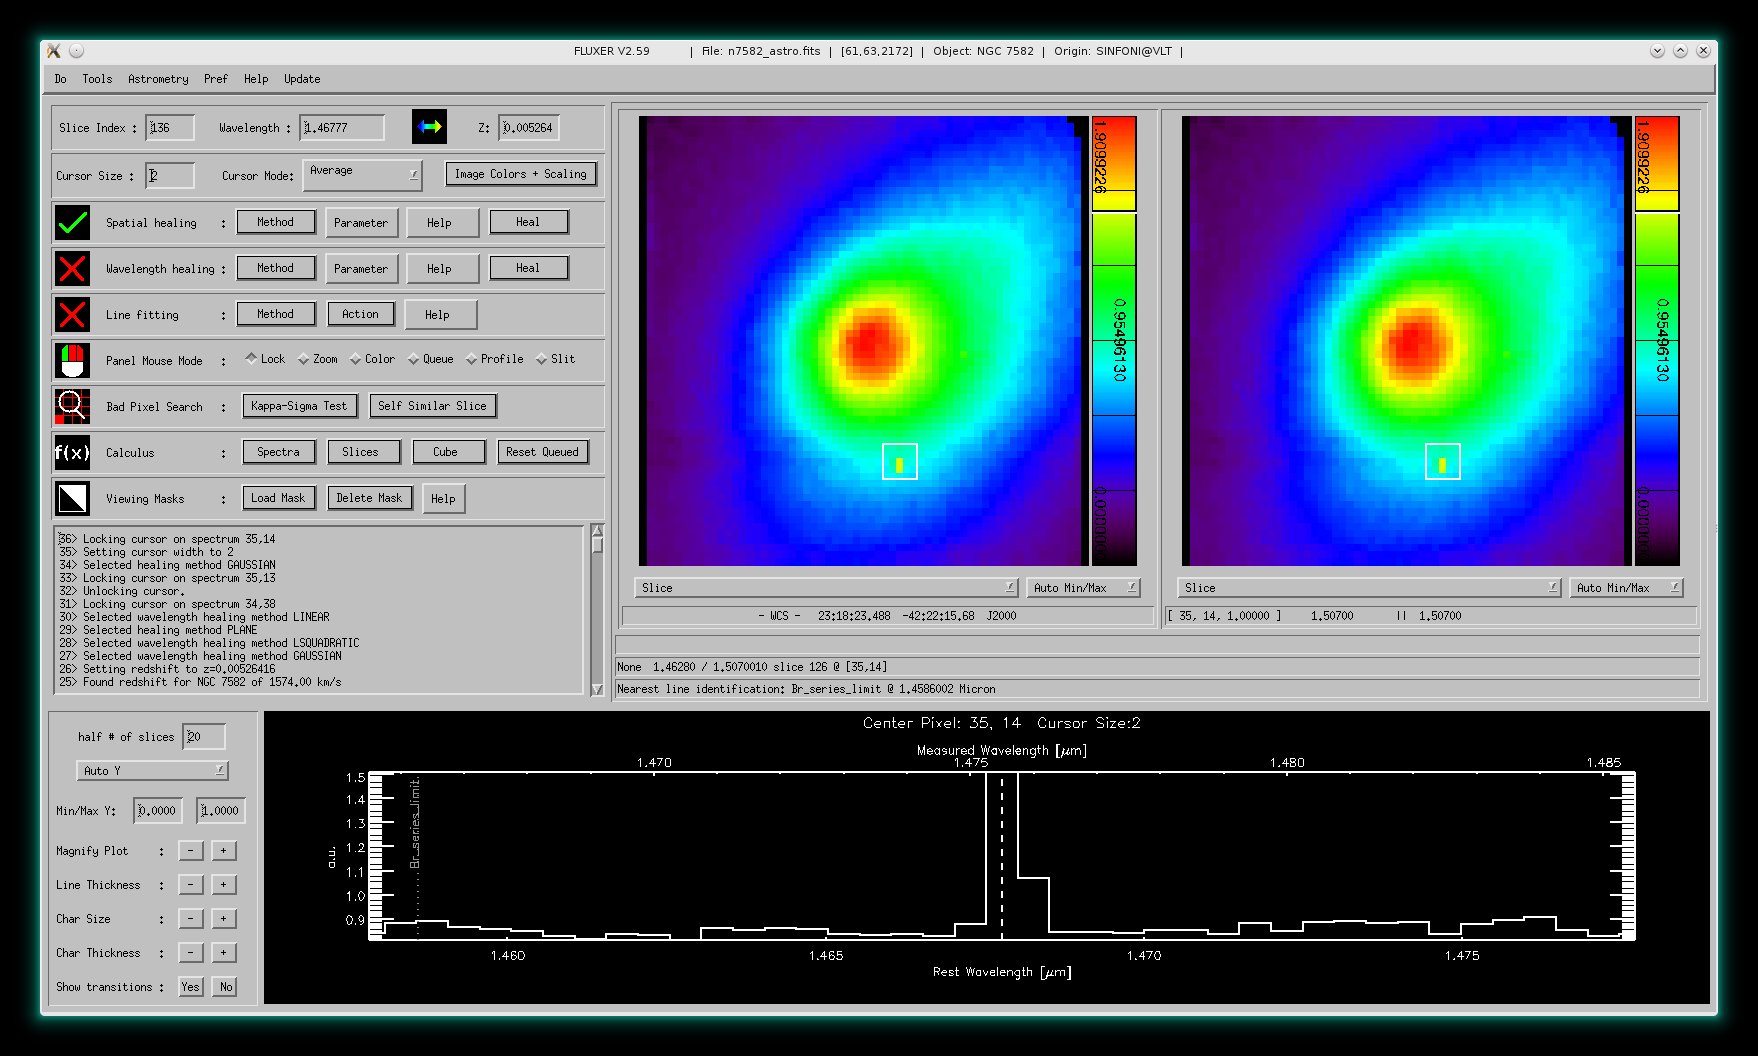
Wavelength healing mode
This mode allows to interactively interpolate pixel values in each spectrum of the
data cube.
The image shows the original spectrum (histogram) and the
result of the interpolation (solid line).
|
Measurement errors
From version 2.59 on, FLUXER allows on start-up to read measurement errors
(and other data too).
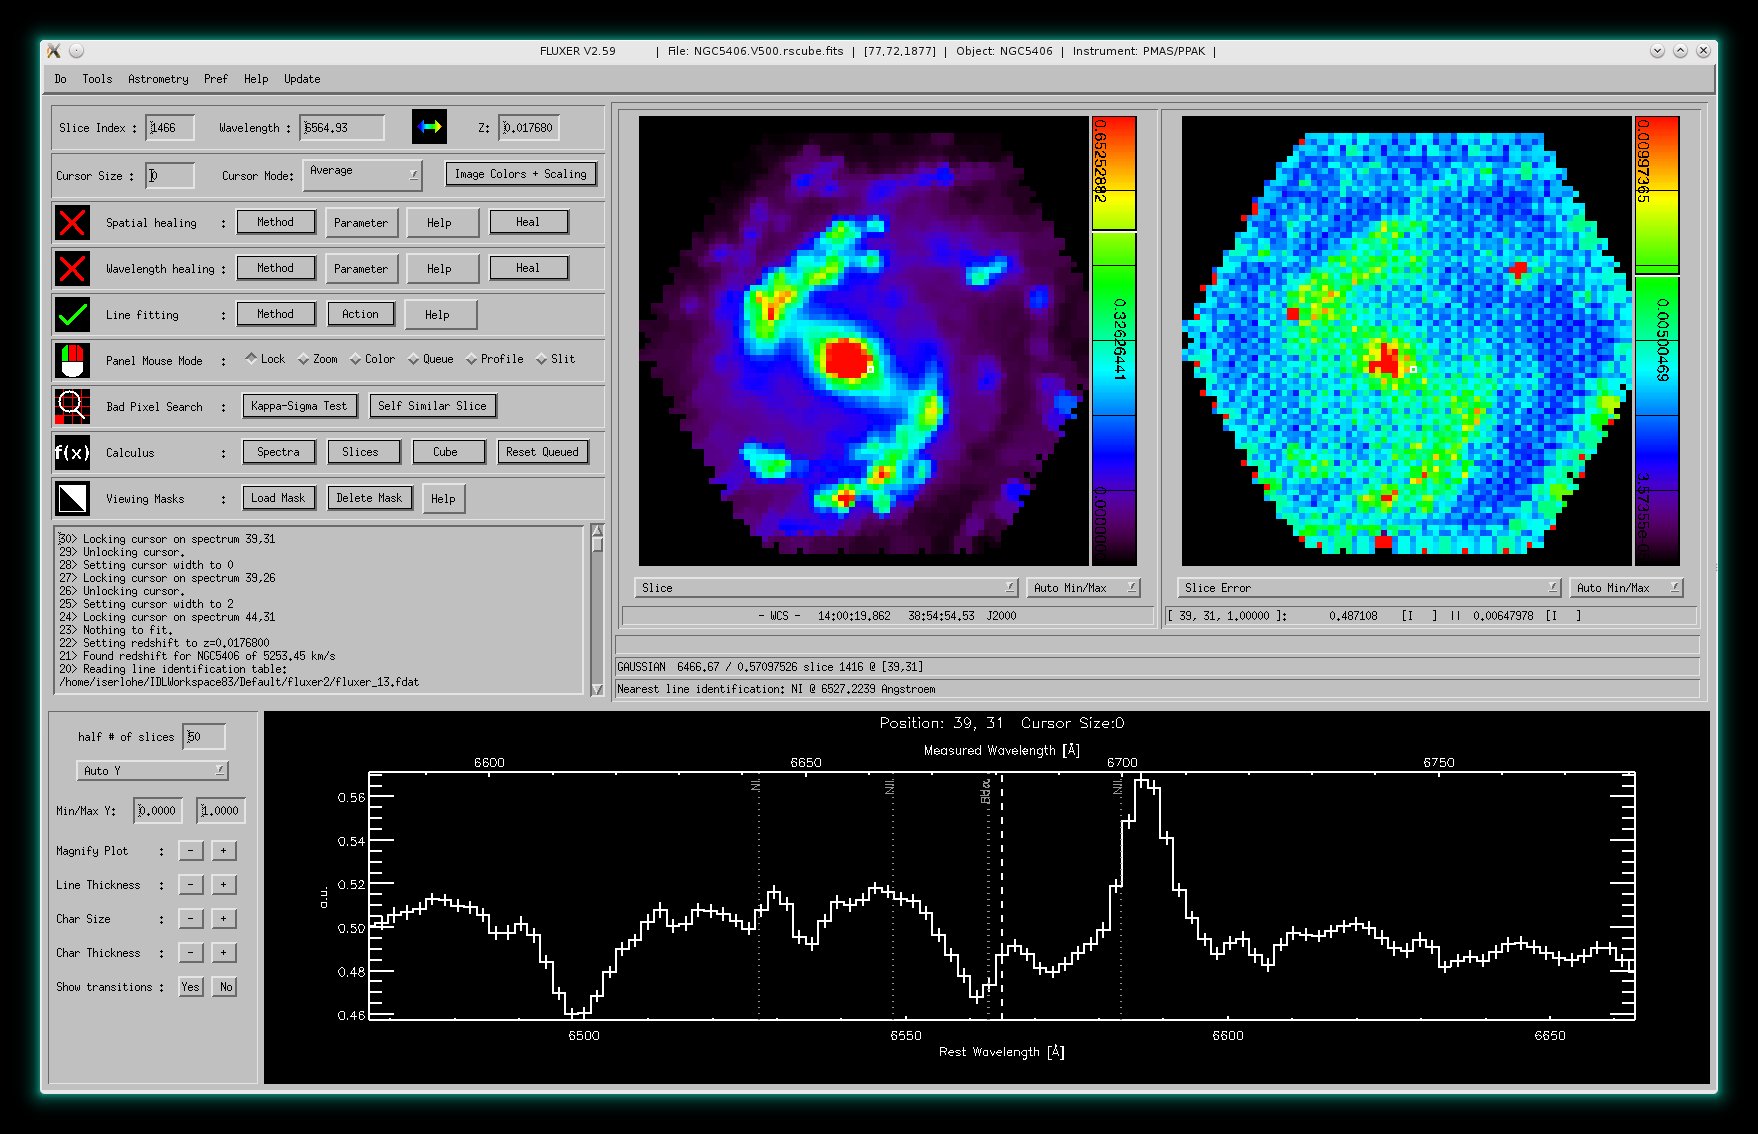
The image shows a spectrum of NGC5406 (data taken with PMAS) together with
measurmenet errors. The right panel window additionally shows the error slice
corresponding to the data slice shown in the left panel window.
FLUXER is able to use measurement errors for all calculations. The only
exception is that measurement
errors values can not be changed
(interpolated) unlike data values.
|
FLUXER Slit extraction and position velocity (PV) Viewer
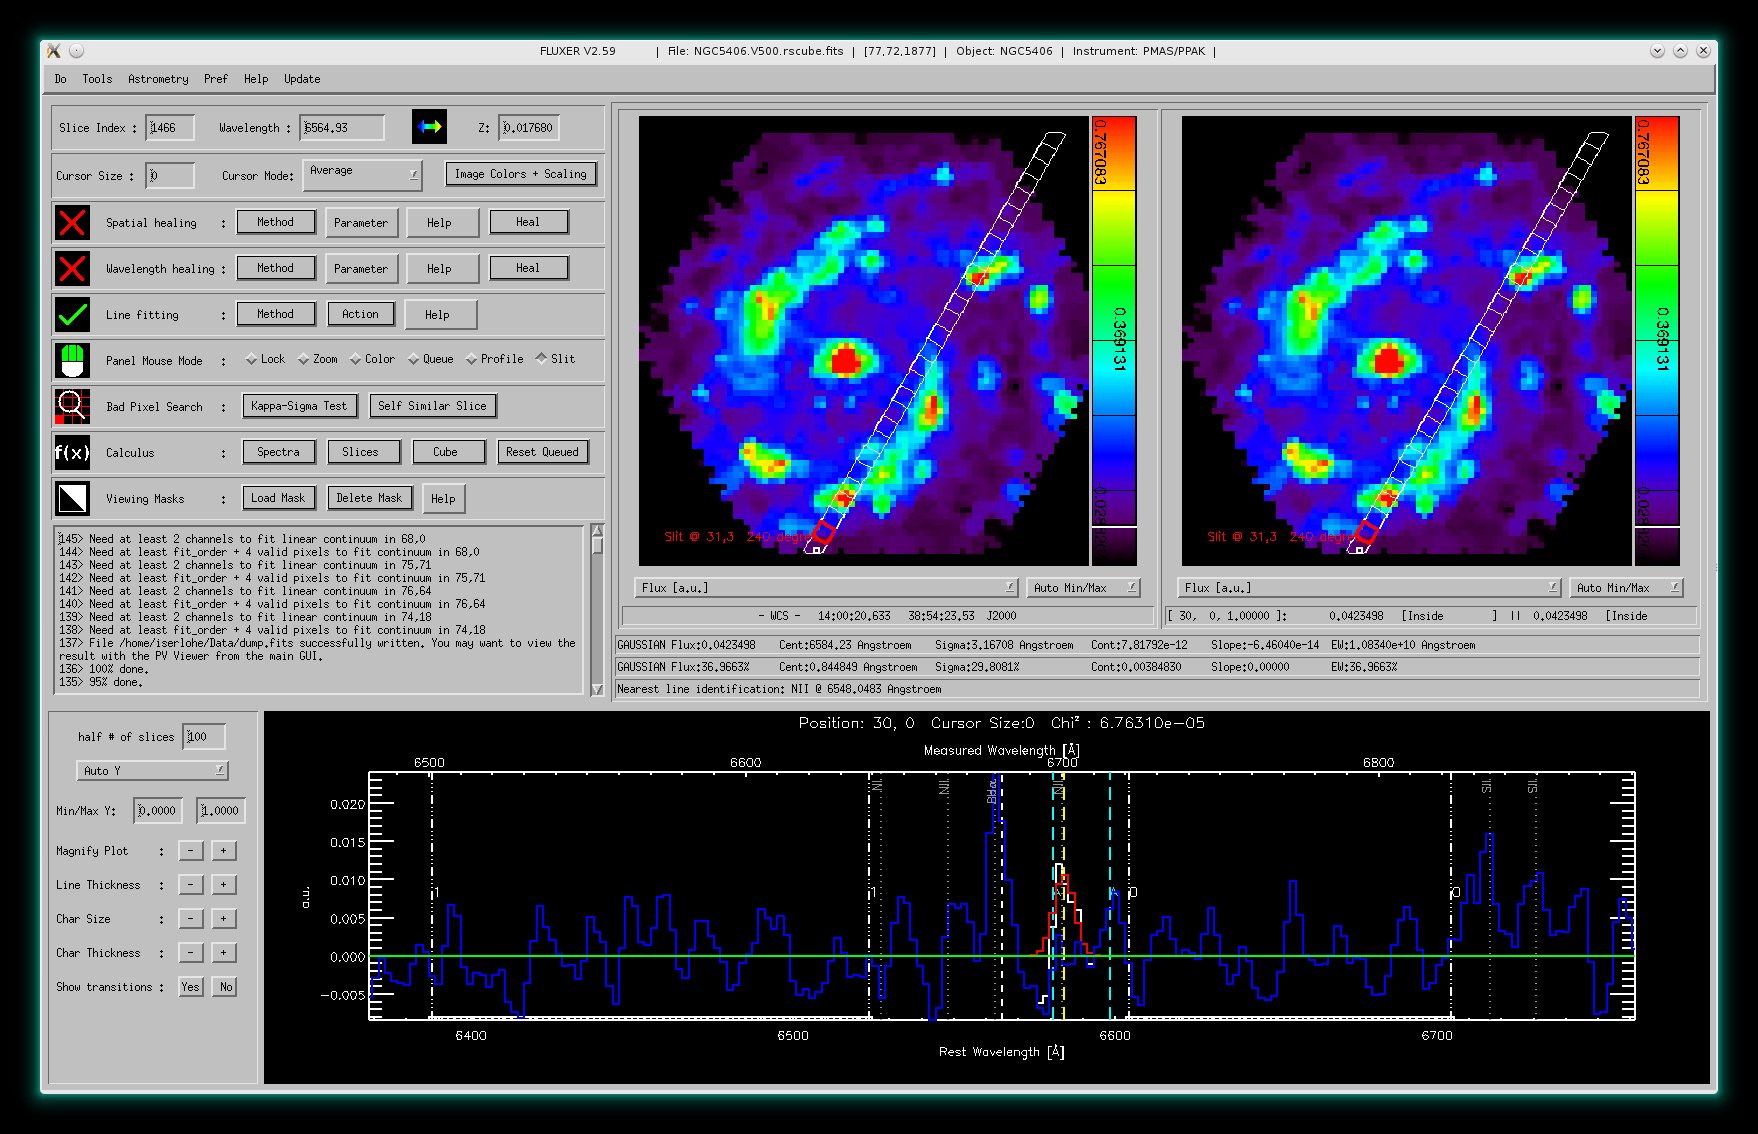
The slit extraction mode.
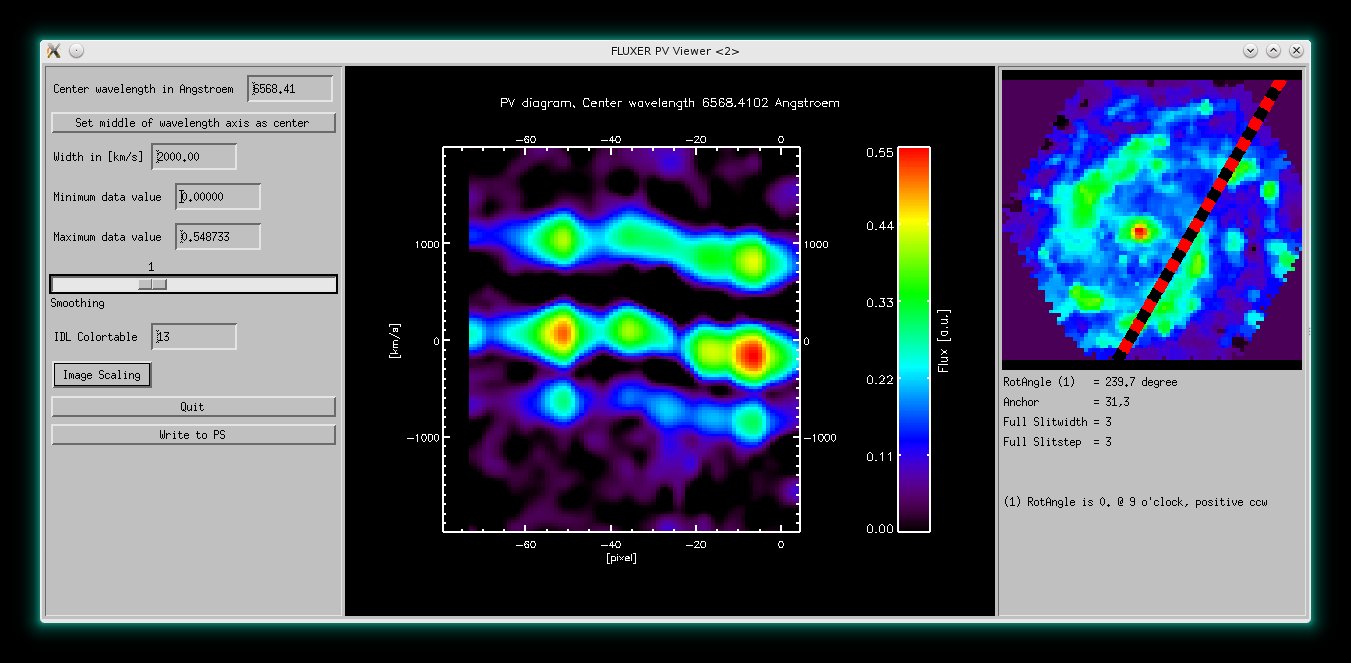
The slit extraction mode and the FLUXER PV Viewer. The PV Viewer shows the continuum
subtracted position velocity diagram centered on Hα. Both accompanying
nitrogen lines are visible including their velocity dependence.
|
FLUXER Plot spectra from multiple locations in the FoV
The image shows individual spectra from selected apertures (as indicated), with velocity offsets relative to H
α in km/s.
|
FLUXER Plot 1D
Enhanced plotting of vectors. FLUXER Plot 1D also allows setting the plot
title, the axis title, fitting of data, smoothing of data, plotting data to
postscript files and so on.
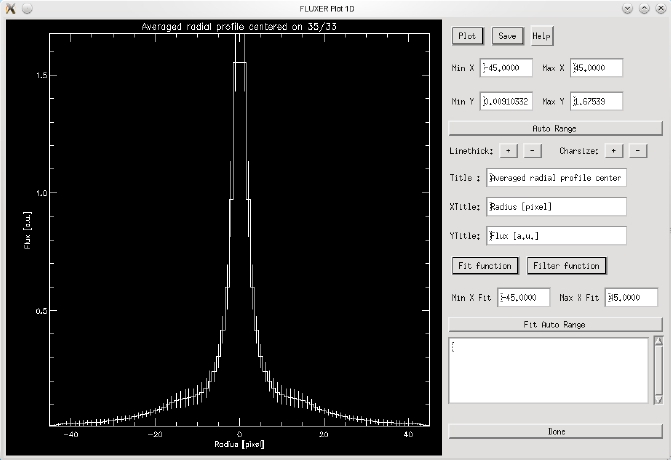
The image shows a radial profile plotted with fluxer_plot1d.
|
In the following some stand-alone programs which can be started from the
IDL commandline immediatly
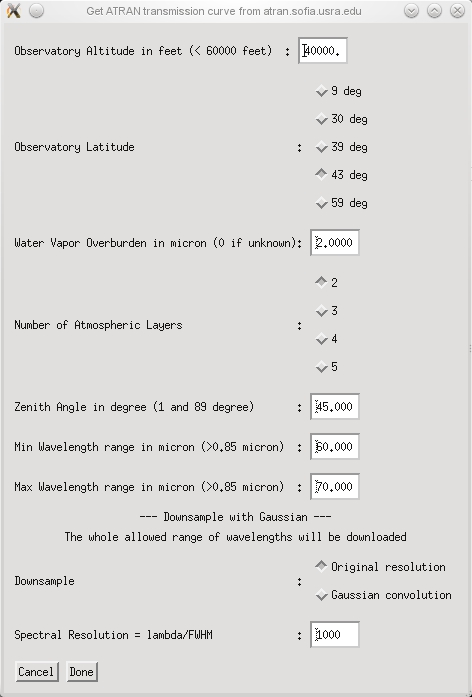
FLUXER ATRAN
From version 2.44 on, FLUXER allows direct access to ATRAN atmospheric
transmission curves. These curves are calculated and downloaded from
atran.sofia.usra.edu. Parameters to be set are equivalent to those in the
atran.sofia.usra.edu web form. Once a transmission curve has been downloaded,
it can be plotted or saved.
ATRAN Reference: Lord, S. D., 1992, NASA Technical Memorandum 103957.
FLUXER ATRAN can be started from the IDL commandline with : result = fluxer_atran()
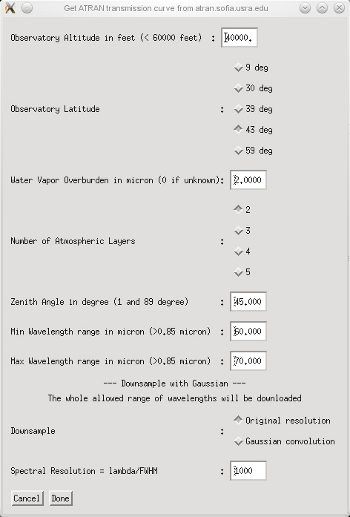
The image shows the GUI which is used to connect to atran.sofia.usra.edu
---
FLUXER DSS/SDSS
FLUXER DSS/SDSS allows to download DSS images and SDSS spectra for the same
region that is covered by the DSS image. FLUXER DSS/SDSS can be started from
commandline with : IDL>fluxer_sdss
The user specifies either the name which is resolved by SIMBAD/VIZIER/NED or
the center coordinates in RA and DEC.
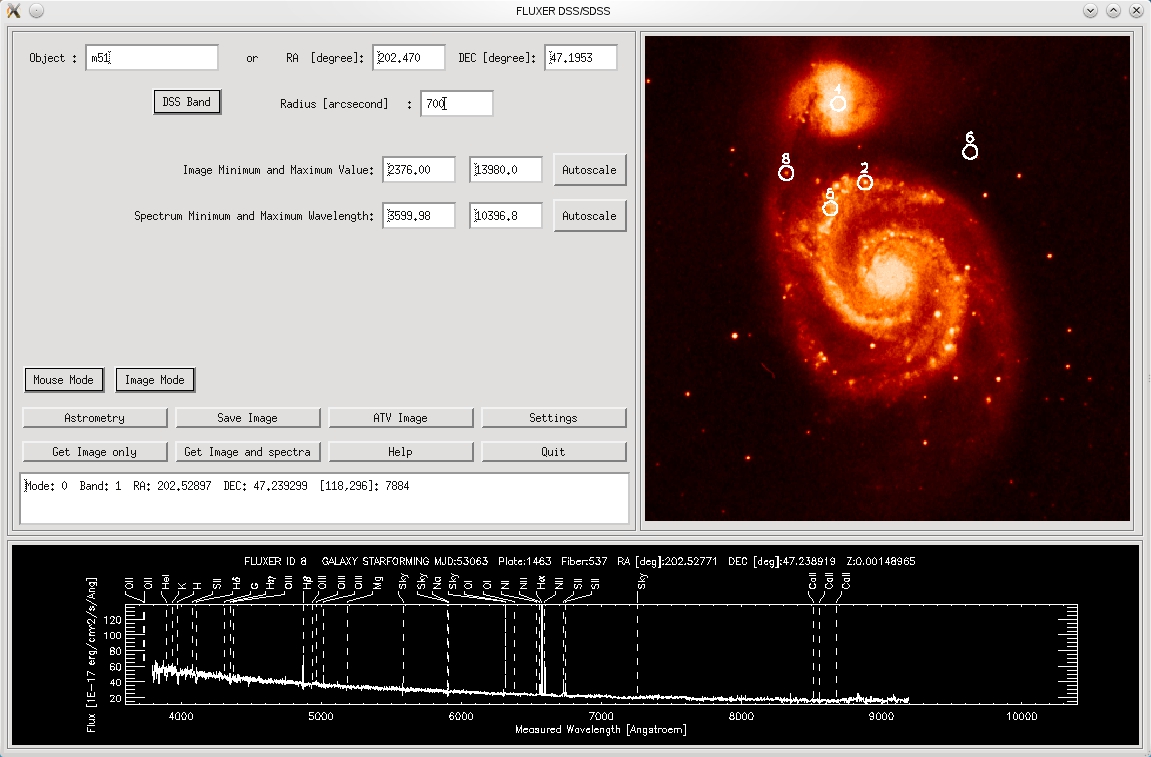
FLUXER DSS/SDSS image and spectrum viewer
---
FLUXER_Aligner
From version 2.60 on, FLUXER_ALIGNER allows to regrid a number of fits images
and RGB fits files with astrometry to a
common grid. FLUXER_ALIGNER can deal with measurement errors as well as
invalid pixel indicators. Astrometry of the input images is not restricted to
a specific equinox or position angle. Regridding is done by linear interpolation.
The tool can also be used for mosaiking images, to create images with same
angular grid or to convolve images with a Gaussian to another angular
resolution, etc., for e.g. subsequent division to compute flux ratio maps.
FLUXER_ALIGNER can be started from commandline only with
: IDL>fluxer_aligner
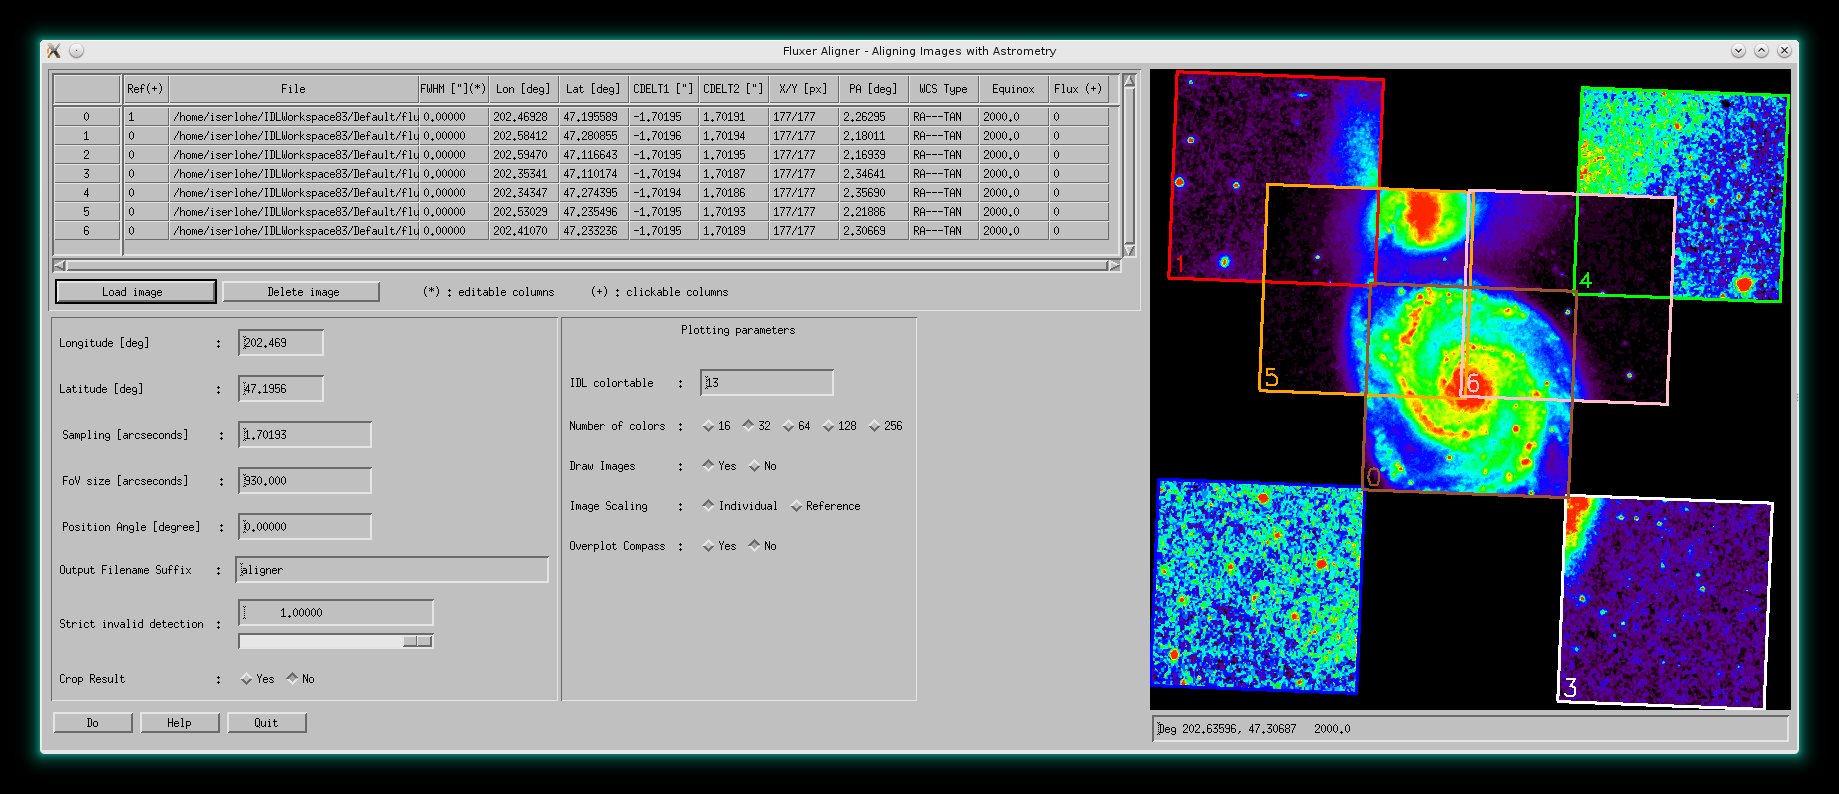
FLUXER_ALIGNER with an image mosaic of M51.
---
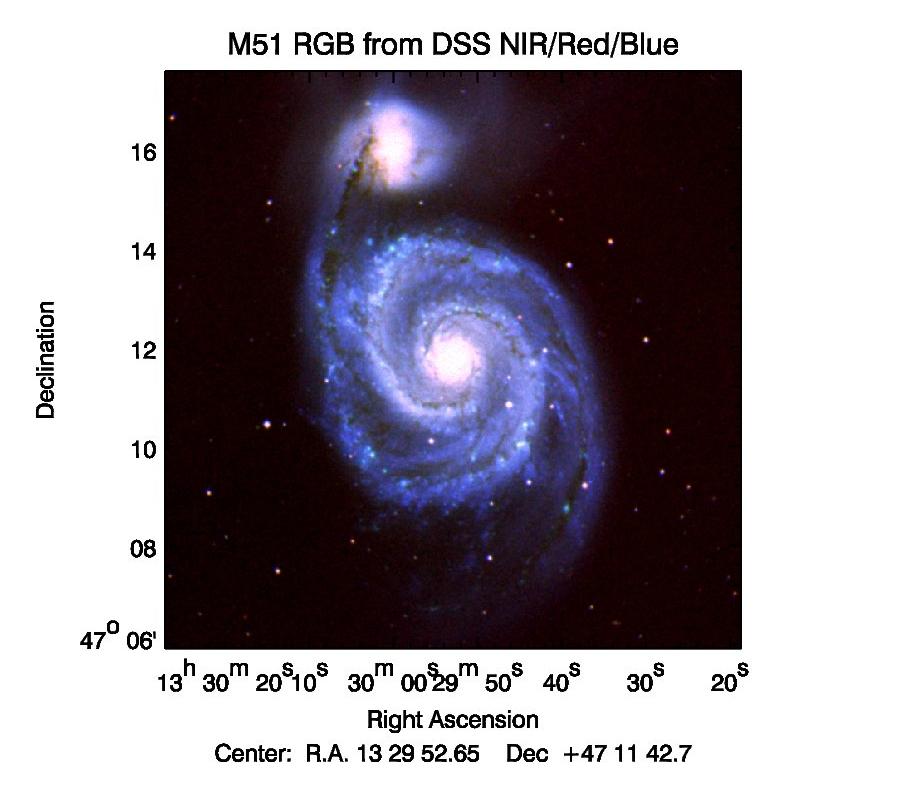
FLUXER RGB
FLUXER_RGB is an easy to use tool to create RGB images from three monochrome
images. It will be available from version 2.64 on. It can be started from the commandline with :
IDL>fluxer_rgb
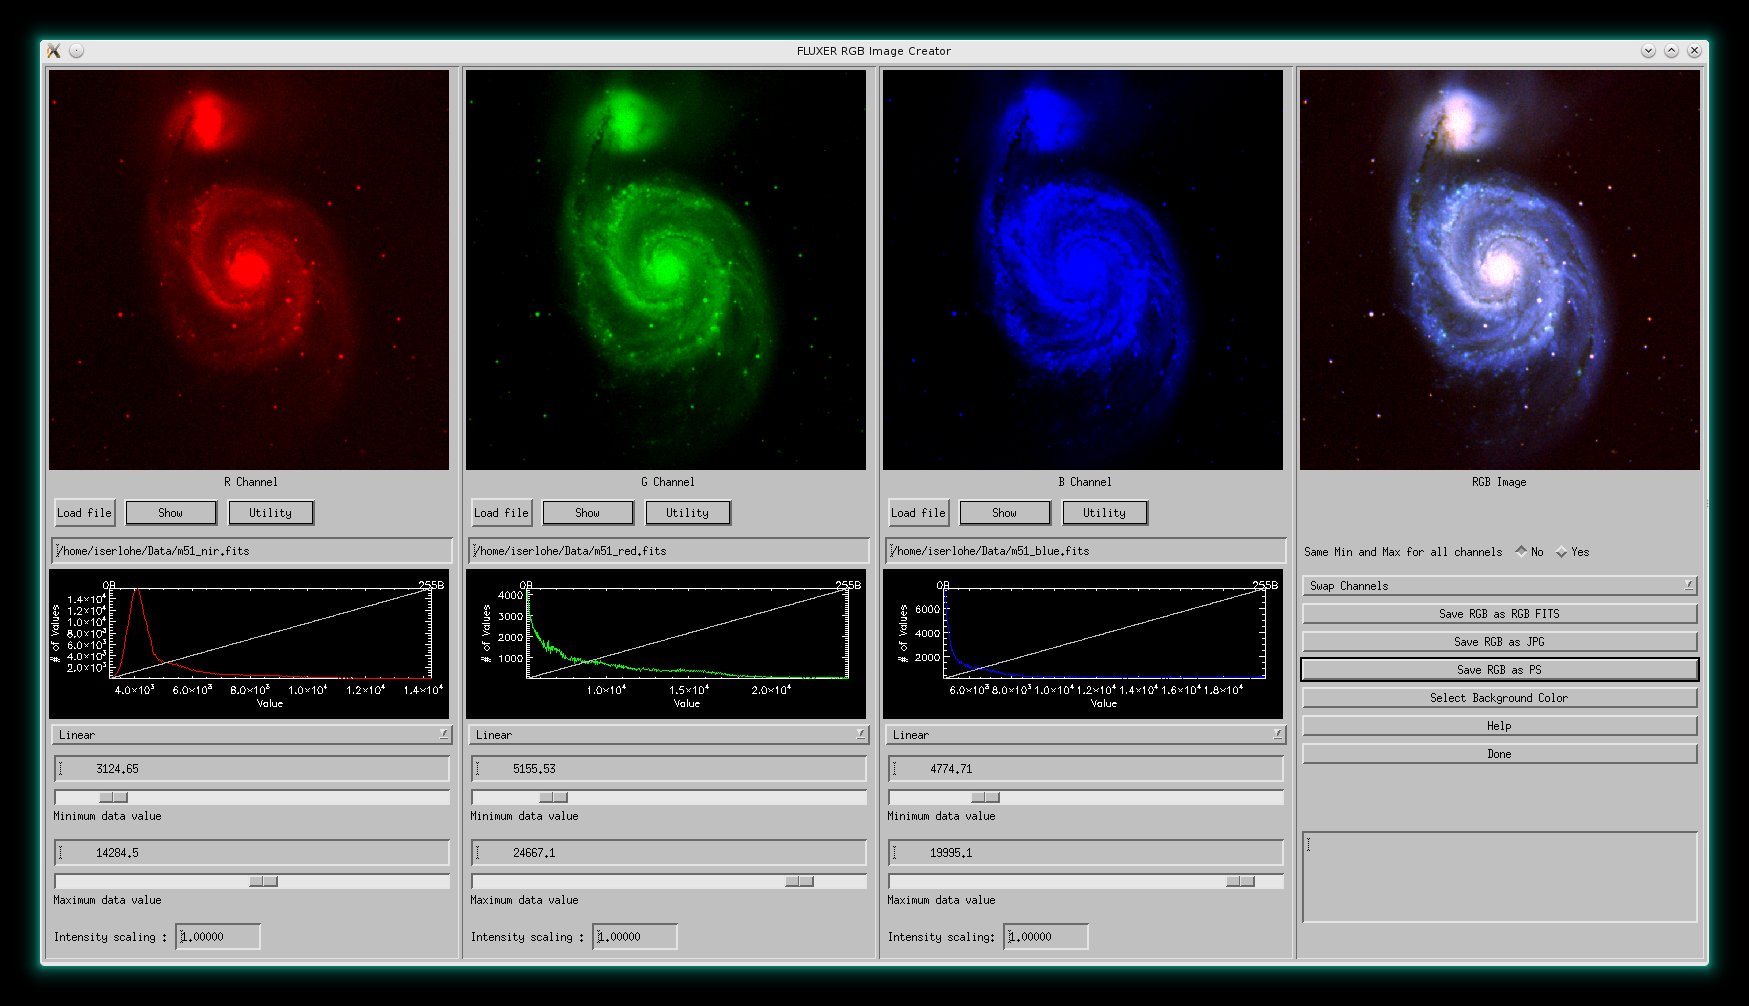
FLUXER_RGB with an RGB image mosaic of M51 (NIR SDSS:red, Red SDSS:green, Blue
SDSS:blue).

PS file created by FLUXER_RGB.
---
FLUXER Astrometor
FLUXER_ASTROMETOR is an easy to use tool to assign a fits coordinate systems to
any JPG image by correlating the positions of point-like objects in the JPG
with positions in a reference fits image that has been downloaded previously e.g. from DSS
with FLUXER_SDSS. The JPG image is saved as RGB fitsfile with tangential J2000
astrometry and can be processed further by e.g. fluxer_aligner.
FLUXER_ASTROMETOR will be available from version 2.65 on. It can be started
from the commandline only with :
IDL>fluxer_astrometor
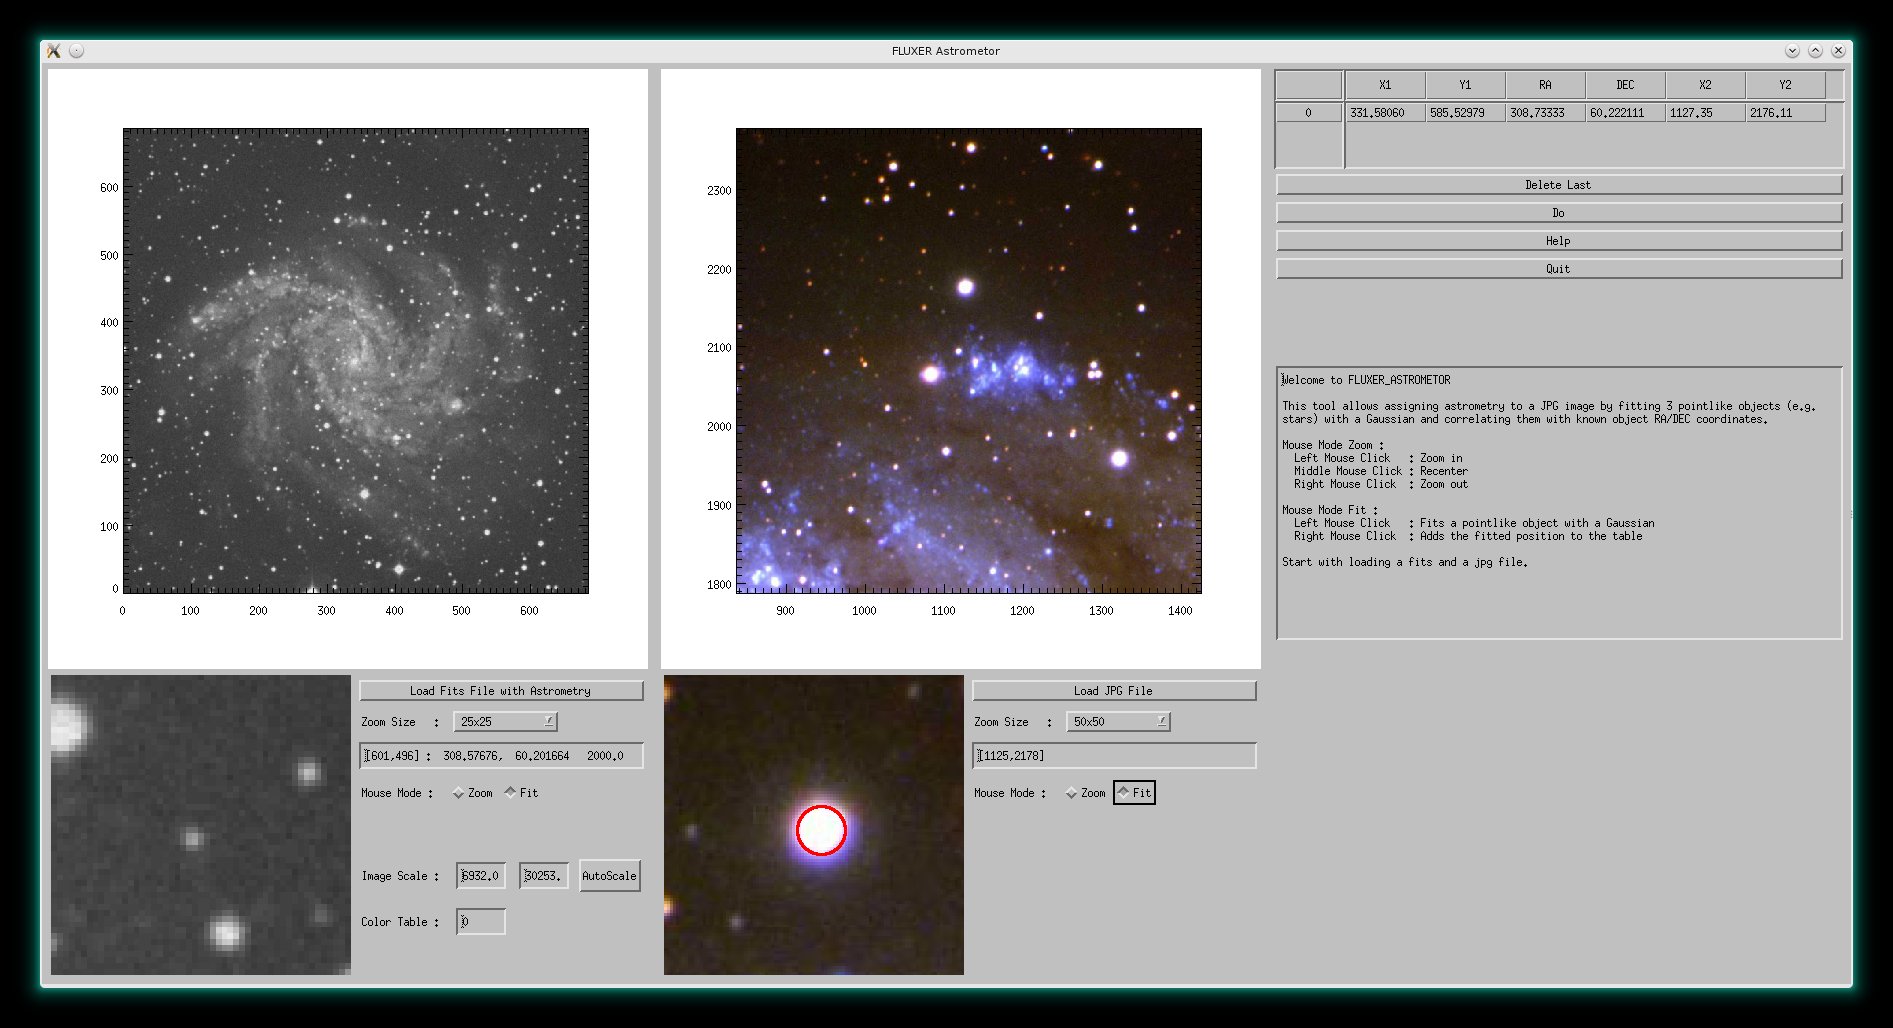
FLUXER_ASTROMETOR with a fits image of NGC 6946 image from DSS and a
photo in the optical wavelength regime from LBT (Vincenzo Testa, Cristian DeSantis).
|
Collection of animated gifs prepared with FLUXER
Rotating spheres illustrating the various 3D rotation methods available.
Imaging spectroscopy datacube (from OSIRIS at Keck
observatory) of the Narrow Line Region of NGC4151. Isosurfaces in the light of [FeII]16440
emission (C.Iserlohe et al., 2013)
Fabry-Perot datacube of supernova remnant 1E 0102.2-7219. Channel maps and
isosurfaces in the light of [OIII]5007 emission (with permission by
J. Morse et al., Rensselaer Polytechnic Institute).
|
Visualization of volume data

MR study of head with skull partially removed to reveal brain, Chapel Hill
Volume Rendering Test Data Set, Volume II, Data taken on the Siemens Magnetom
and provided courtesy of Siemens Medical Systems, Inc., Iselin, NJ. Data edited
(skull removed) by Dr. Julian Rosenman, North Carolina Memorial Hospital,
University of North Carolina. Channel maps and volume rendering with
superimposed and shifted projections along the axes.
|
|
Download
|
Requirements :
IDL version 8.0 and above. FLUXER may work with version 7.0 but this is
untested. If you run FLUXER with version 7.x and experience any problems
please do not hesitate to send a bug report.
Download :
Please send me a note to christof [at] ciserlohe [dot] de
if you want to use FLUXER.
Bug reports :
If you encounter any bug in FLUXER that is reproducable, please help me to
improve FLUXER by sending a bug report to :
christof [at] ciserlohe [dot] de
Before you send a bug report please ensure that you followed step 3 in
the Installation guide section to get
additional debugging output.
A bug report must always (!) contain :
- All output on the IDL command line and (!) the Workbench (from the very
start of FLUXER) until the error occurs.
- The name and version number of the operating system you are using.
- A short description of what you did and what you want to do.
Important notes on physical properties :
Any derived 'Flux' is a sum of bins. E.g. in gaussian fitting mode the
'Flux' derived by FLUXER is the area of the fitted gaussian divided by the
spectral bin width (the CDELT of your wavelength axis). For a detailed
explanation of derived quantities please see 'Help->Line fitting' from the
main menu bar or see fluxer_help_fit.txt or fluxer_help.txt.
Important version changes :
To allow immediate signal-to-noise estimation some fit errors derived are
scaled to the data. E.g. a flux error of 10% for a
fit means that the actual flux error is 0.1 * derived flux for that fit.
When saving fit results, the first extension of the
saved file has these scaled errors. To allow other programs to directly access the
fit error (without the above multiplication), from version 2.60 on, the flux,
width and equivalent width errors saved are actual errors.
|
Installation guide |
The IDL libraries you need:
These libraries are needed and must be installed (only once):
Do not forget to add the libraries to your !PATH environment variable.
If you encounter problems with any of the libraries (e.g. due to version
conflicts), please contact me.
Getting nice example data cubes:
Very nice astronomical data cubes can be download from
the CALIFA
(Calar Alto Legacy Integral Field spectroscopy Area) Survey. You can download a nice data cube from
NGC5406 here
(77 MB).
How to install:
Only few simple steps are neccessary to install FLUXER:
0. I recommend to copy FLUXER and the libraries to the IDL Workspace
directory.
1. Define an environment variable, FLUXER_HOME. FLUXER_HOME must
contain the path where you have installed FLUXER.
E.g. using a bash shell under Linux, add something like this to your .bashrc:
export FLUXER_HOME="/home/christof/IDLWorkspace83/Default/fluxer/"
2. If you haven't done already, define an IDL startup file. This file is
executed each time IDL is started and should update your !PATH environment
variable on startup with the correct paths to all your IDL programs and
libraries.
Add an environment variable named IDL_STARTUP which gets the path and name of the idl
startup file, e.g., ~/.idl_startup (~ means your home directory).
E.g., using a bash shell under Linux add the following line to your .bashrc file:
export IDL_STARTUP=~/.idl_startup
Create the idl startup file and add the following line to it,
in which you have replaced XXX with the path and name of the directory where
all your IDL programs and libraries live, e.g., your IDL
Workspace directory:
!PATH = Expand_Path('+XXX') + ':' + !PATH
3.(optional) To get more debugging information in parallel mode define an environment
variable named IDL_BRIDGE_DEBUG with
a value of 1.
E.g., using a bash shell under Linux add the following line to your .bashrc file:
export IDL_BRIDGE_DEBUG=1
Remember that new environment variables under Linux take effect after
you have started a new terminal.
Now, start IDL and FLUXER from, e.g., the command line in one of the ways listed below :
- IDL>fluxer, 'my_datacube.fits'
- IDL>fluxer, my_datacube
- IDL>fluxer
When reading fits files, FLUXER determines the number of extensions of this
file and asks which to load. When reading an extension, FLUXER tries to read
the header of the primary as well as of the extension. Both headers are then merged.
If a data cube is read, the last (third) axis is always
considered as the slicing direction. This means that the first two axes describe an
image, the third the stacking of the images.
When dealing with astronomical data cubes read from a fits file these must follow
fits conventions. E.g. the order of the axes must be right ascension,
declination, wavelength.
When providing a data cube directly to FLUXER, the program asks the user which
axis indicates the slicing direction unless the header keyword is used to
provide a header to FLUXER (see the help pages in the installation package).
How to configure:
Once the main GUI has started, you should define a standard preference
file. This is done by clicking 'Pref->Set' in the menu bar.
The following configurations should be set:
- 'Data Units': If wavelengths are defined in the header of your data file (CRPIX3, CDELT3 and CRVAL3 fits
keywords are defined), select the appropriate 'Data units' representing the
wavelengths. This can be micron, nanometers or Angstroem.
- 'Line identification tables': Select some of the predefined line identification tables. You do not need
to define your own.
- Saving the configuration file: Save the preference file by clicking 'Done and Save' into a file named
'fluxer.fpref'. This is the preference file loaded on
startup. You can define additional preference files which can be loaded during
runtime.
Hints: Additionally you may want to set a larger panel window size to fill
your whole screen. You can limit the number of CPUs used during parallel processing
to save main memory.
And finally, if you are bothered by
the auto check for updates on each FLUXER startup, you can switch it off in
the preference GUI as well.
How to update:
For reasons of security, there is no automatic update procedure. FLUXER is
never deleting any files from your computer. You can perfom the update by
downloading the zip file with the newest version. Then, move your old FLUXER
version out of sight of IDL. E.g. delete it or if you want to keep the older
version, move the whole FLUXER directory into a directory that is not
included in the !PATH environment variable, otherwise you may run into version
conflicts. Now, extract the zip file into any directory that is listed in your
!PATH environment variable. Please note, that you have to create new
preference files after each update since new preference options may have been
introduced in newer FLUXER versions (see 'How to install' above) ! If you have
created your own link list in
fluxer_urls.dat to be displayed in the "Tools->Browse" menu, secure
that file as well.
Version history since 2.24:
| 2.25 : | Slit extraction and pv diagrams introduced |
| 2.26 : | Introduced plotting spectra from multiple locations in the FoV to a postscript file |
| 2.27 : | Choosing arbitrary contour levels introduced. |
| 2.28 : | Improved Gaussian and Moffat image fit |
| 2.29 : | Introduced arbitrary peak orientation when fitting gaussians, lorentzians or in dci mode |
| 2.30 : | Introduced fitting always additionally the continuum linearly and Width
for peak fitting in km/s if wavelenths are present |
| 2.31 : | Introduced writing gifs with tranparent background where outside |
| 2.32 : | Introduced sigma clipping for determining the min/max values in
colorbars |
| 2.33 : | Introduced subtraction of the continuum in all spectra |
| 2.34 : | Introduced extended one-dimensional plotting, fluxer_plot1d.pro |
| 2.35 : | Enhanced radial profile plotting |
| 2.36 : | Changed wavelength calculation to FITS convention (the reference pixel
start to count at 1). |
| 2.37 : | Introduced Voronoi Binning method of Cappellari & Copin
(2003, MNRAS, 342, 345) |
| 2.38 : | Replace individual fits in a set of fits and introduced sorting the
results from double gaussian fits before saving. |
| 2.39 : | Introduced checking for updates, fixed a plotting bug in fluxer_plot1d
and introduced plotting smoothed contours. |
| 2.40 : | Introduced equivalent widths and error in continuum |
| 2.41 : | Introduced saving and reading fit regions to or from a file |
| 2.42 : | Individual fit regions can be deleted now |
| 2.43 : | Introduced large catalogues of emission and absorption lines (Atomic, Fine
Structure, Molecules) from the optical to the far-infrared |
| 2.44 : | Download ATRAN atmospheric transmission spectra from
atran.sofia.usra.edu and resample to specified
wavelength range and convolve with a Gaussian to desired
spectral resolution (ATRAN: Lord, S. D., 1992, NASA Technical
Memorandum 103957) |
| 2.45 : | Ability to load a data
cube while FLUXER is running. Minor bug fixes |
| 2.46 : | Introduced FLUXER
DSS/SDSS to download and view DSS images and SDSS spectra. Ability to save
residuals of line fits |
| 2.47 : | Improved fits file
reading (for GEMINI data). Bug fix for residuals in COI and DCI line
fitting mode |
| 2.48 : | ATRAN website calls
have changed. fluxer_atran updated |
| 2.49 : | Minor technical
changes. Improved astrometry |
| 2.50 : | Minor bug
fixes. Introduced ATRAN emission spectra |
| 2.51 : | - Introduced H2O
and O3 line identification tables for a wavelength range of 1 to 200 micron
from HITRAN. To keep the list handy, only the 10 brightest transitions per
one micron bin are listed.
- Due to a missing subroutine some of
the spatial healing methods, from version 2.49 on, did not work propperly.
Repository updated.
- Removed external libraries from the repository. |
| 2.52 : | - Parinfo
editor for constraining fit parameters
- Fitting Gaussian and
Lorentzian together with polynomial baseline (mpfitpeak with nterms > 3)
- Get redshift and further
information about your object from NED or SIMBAD
- Improved postscript
plotting
- URL Queries updated
- χ2 calculation
-
Minor bug fixes |
| 2.53 : | - Allows to
set the panel window size in the preference file |
| 2.54 : | - Very much improved
postscript plotting
- Minor bug fixes |
| 2.55 : | - Auto check for
updates on startup |
| 2.56 : | - Open links in web
browsers, get infos about your object from NED or SIMBAD with one mouse
click
- view current active line identifications
|
| 2.57 : | - Divide a cube by an
ATRAN spectrum
- Mirror the cube and update the
header.
|
| 2.58 : | Minor bug fixes
|
| 2.59 : | - Introduced
plotting masks. These allow to plot images with constraints. E.g. plot
only flux values if the calculated error on the flux value is less than
20%.
- Taking measurement errors into account, if available. Error bars will
be overplotted to the spectra.
- Improved contouring
- Improved Postscript creation
- Improved usage of FLUXER
- Minor bug fixes, the only critical one fixes a wrong scaling of the
colorbar image in histogram mode.
|
| 2.60 : | - Introduced
fluxer_aligner for resampling and aligning images with astrometry.
- Extended fits header checking
- Minor bug fixes |
| 2.61 : | - Faster start-up
|
| 2.62 : | - FLUXER goes
parallel. Fitting your spectra can now be done in parallel processing
mode. Depending on the number of cores of your CPU this may speed up
your calculations by factors. Parallel processing is fully automated and
no user interaction is required. Version 2.62 is beta.
|
| 2.63 : | - FLUXER allows to
set the number of CPUs in parallel mode.
|
| 2.64 : | - FLUXER_RGB allows to
create an RGB image interactively from three monochrome images.
- Fixed setting manual y ranges for plotting spectra in FLUXER
|
| 2.65 : |
- Introduced status images in FLUXER, FLUXER_RGB and FLUXER_ALIGNER.
- Introduced FLUXER_ASTROMETOR
- Fixed equinox problems in FLUXER_ALIGNER.
|
| 2.66 : |
- Bug fixes
|
| 2.67 : |
- Complete rewwrite of fluxer_aligner core algorithm. Please see the
documentation about the changes.
|
| 2.68 : |
- Minor bug fixes
|
| 2.69 : |
- Failed writing double gaussian fit results fixed
|
| 2.70 : |
- Improved FLUXER_ALIGNER
|
| 2.71 : |
- Improved contour plotting
|
| 2.72 : |
- Fixed file unit error that occurs after many openings of files from FLUXER.
|
| 2.73 : |
- Allows to select an alternative default font. Useful to, e.g., increase
the font size in the GUI (to get bigger buttons).
|
| 2.74 : |
- Redshift dialog, Image Color Pattern and Scaling dialog and Undo of Continuum
subtraction introduced.
|
| 2.75 : |
- ATRAN server moved to atran.arc.nasa.gov. Updated fluxer_atran.pro
- The Line/Axis thickness, charsize, charthickness and size of the plot
window are saved in the preferences (by default)
|
| 2.76 : |
- New Contour Dialog
- New Color Selection Dialog
- Possibility to resize the main GUI
- Smaller menu changes
|
| 2.77 : |
- Changes to fluxer_plot1d
|
| 2.78 : |
- Selecting the background color for outside and queued pixel
|
Notes on available predefined line identification tables:
| 1.5 - 2.4 micron | | Ne, Ar, Xe, Kr arclamp lines
| | 1.5 - 2.5 micron | | CO bandhead
| | 1.0 - 2.5 micron | | Coronal lines in the NIR
| | 1.3 - 1.8 micron | | [FeII] lines - Ritz wavelengths from NIST
| | 0.1 - 349 micron | | [FeIII] lines from Nahar and Pradhan, 1996, AAS, 119,509
| | 1.0 - 28 micron | | Ro-vib transitions of H2, Black and van Dishoeck, 1987, ApJ, 322, 412B
| | 0.3 - 12 micron | | Atomic Hydrogen (Ba, Br, Pa, Pf, Hu)
| | 1.0 - 2.5 micron | | HeI and HeII lines
| | 2.0 - 205 micron | | Atomic and Ionic Fine-Structure Lines, compiled by Dieter Lutz
| | 2.4 - 187 micron | | H2, HD, H2O, OH and CO Lines, compiled by Ewine van Dishoeck
| | 1.1 - 2.3 micron | | OH lines from Chamberlain, Hubbard and Brault
| | 0.3 - 1.0 micron | | OH sky lines
| | 0.1 - 0.9 micron | | SDSS emission and absorption lines
| | 0.1 - 1.1 micron | | UV to NIR emission lines in SNR, Fesen and Hurford, 1996, ApJS, 106, 563F
| | 0.8 - 2.4 micron | | Stellar absorption bands in the NIR
| | 1.0 - 200 micron | | 10 brightest H2O lines per one micron bin, from HITRAN
| | 1.0 - 200 micron | | 10 brightest O3 lines per one micron bin, from HITRAN
|
See also http://www.mpe-garching.mpg.de/iso/linelists/
or Atomic Line List v2.04.
See FLUXER help pages for how to create your own line identification
table.
|
FAQs
and
Trouble shooting
|
- Workbench in IDL 8.x:
Some IDL versions (8.0 or higher) may (or may not) have problems with hardware and
software rendering under some operating systems when using the
workbench. If you experience similar problems with the workbench, run FLUXER in a
shell/terminal using the IDL command line only.
You can also try (on your own risk) to delete the configuration files of the
workbench. E.g., rename your .idl directory to e.g. .old_idl and start the workbench
again.
- Parallel processing :
Fitting your spectra in parallel processing mode speeds up the calculations
significantly depending on the number of cores your CPU has.
However, it can not be used if your computer is not equipped with enough main
memory (depending on the size of your datacube) feeding the child processes.
Additionally, child processes may not be
stopped by pressing Ctrl-C and you may have to manually kill all IDL
processes.
A common cause for trouble with parallel processing could be that in your IDL setup the !PATH
environment variable is not transferred to the child processes which is done
in FLUXER using an IDL startup file. Please follow steps 2 and 3 in
the Installation guide section above.
- mpfitfun or mpfitpeak errors :
FLUXER uses the famous mpfit package written by Craig Markwardt. Since many
IDL programs are using the mpfit package you may already have it installed.
However, ensure that you only have one (!) version (the
newest) of the mpfit package installed. Otherwise you may run into version conflicts.
- I get tons of error messages when starting FLUXER : Ensure that your
!PATH environment variable is set correctly.
E.g., if the lib directory of your IDL distribution where the routines for,
e.g., compound widgets (like cw_form.pro and so on) are stored
is not listed in !PATH you will get tons of error messages. Also ensure that
all libraries needed by FLUXER are listed in !PATH.
- I accidently selected an alternative default font which is
unreadable. Now the GUI is unreadable.
: Edit your preference file, e.g., fluxer.fpref, and delete the line
that looks like this one :
widget_control, default_font='fff'
Restart your IDL session.
|
Disclaimer |
This software package (FLUXER) comes with no guarantee whatsoever.
|
Credits |
If you are using FLUXER for your publications please add a
short note about having used Fluxer to your acknowledgements.
FLUXER uses some software written by others. Some routines have been
modified, renamed and have been integrated into FLUXER. Except the libraries
mentioned above no additional libraries need to be downloaded.
- Aaron Barth (ATV, Barth, A. J. 2001, in ASP Conf. Ser., Vol. 238,
Astronomical Data Analysis Software and Systems X, eds. F. R. Harnden, Jr.,
F. A. Primini, & H. E. Payne (San Francisco: ASP), 385, http://www.physics.uci.edu/~barth/atv/),
- Craig Markwardt (e.g. fitting libraries, http://www.physics.wisc.edu/~craigm)
- Siree Vatanavigkit (image interpolation)
- Fred Knight (multiplot)
- Michele Cappellari (Voronoi tessellation, Cappellari & Copin (2003, MNRAS, 342, 345), http://www-astro.physics.ox.ac.uk/~mxc/software/)
- and of course the GSFC IDL Astronomy User's Library (idlastro.gsfc.nasa.gov)
- Coyote library written by David W. Fanning (http://www.idlcoyote.com/).
|
Last Update |
1/28/2019
|